Dates: 25th November 2014 to 14th December 2014
Vessel: RV Cape Ferguson
Survey leader: Michelle Jonker
Summary
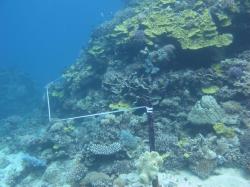
Manta tow surveys of median reef-wide live hard coral cover (henceforth coral cover) and the coral feeding crown-of-thorns starfish (COTS), Acanthaster planci were completed on 22 reefs in the Cooktown-Lizard Island sector and 5 reefs in the Princess Charlotte Bay sector of the Great Barrier Reef (GBR). Intensive scuba surveys for benthic organisms, fishes and agents of coral mortality were also completed on 8 reefs in the Cooktown-Lizard Island sector. Preliminary results of manta tow and scuba searches are presented in this report.
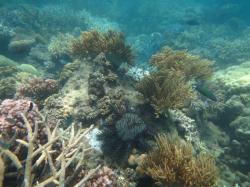
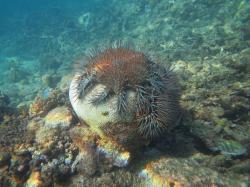
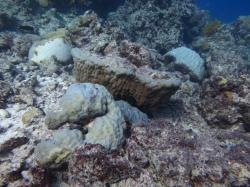
Manta tow surveys indicate COTS numbers on reefs in the Cooktown-Lizard Island sector remain at historically high levels and that populations had increased on many mid-shelf reefs. Along with increasing COTS activity on these reefs there has been a corresponding decline in coral cover. The decline in coral cover was likely due to the combined effects of COTS and Severe Tropical Cyclone Ita, which passed through the Cooktown-Lizard Island sector in April 2014. The AIMS weather station at Lizard Island recorded a maximum wind speed of 158km/hour (85 knots) on 11th April 2014 (AIMS, 2015). Damage attributed to Cyclone Ita was observed on 6 mid-shelf and 4 outer shelf reefs within the Cooktown-Lizard Island sector, but was not observed in the Princess Charlotte Bay sector. Most of the reefs in the Cooktown-Lizard Island sector with cyclone damage did not have high densities of COTS at the time of survey. Manta tow surveys in the Princess Charlotte Bay sector showed the COTS population on one mid-shelf reef had increased to Incipient Outbreak levels. No COTS were observed on the 4 outer-shelf reefs surveyed. Coral cover was moderate to high on outer-shelf reefs in the Princess Charlotte Bay sector. This was the first time these outer reefs had been surveyed in nine to fourteen years.
Scuba search surveys on eight intensive survey reefs recorded few agents of coral mortality. Signs of white syndrome disease were rare or absent and similar to the levels recorded during the last survey in 2013. Low numbers of COTS were recorded from two mid-shelf reefs and numbers of the coral feeding snail, Drupella spp. were also low.
A complete summary of results is presented in Tables 1, 2 and 3.The monitoring program design and sampling methods can be found here in the Standard Operational Procedure Numbers 3, 9 and 10. An explanation of the COTS outbreak terminology can be found in here.
Princess Charlotte Bay Sector.
One mid-shelf reef (13-124) was surveyed by manta tows. COTS numbers on this reef had increased significantly from when it was last surveyed in 2013. Reef 13-124 was reclassified as an Incipient Outbreak in 2015. No COTS were observed during manta tow surveys on the 4 outer-shelf reefs surveyed in this sector. One outer-shelf reef (Davie) was reclassified as Recovering because when it was last surveyed, eleven years ago, the reef had an active COTS outbreak. The other 3 outer-shelf reefs remained classified as No Outbreak.
Coral cover was high (30-50%) on 3 outer-shelf reefs in this sector. Moderate coral cover (20-30%) was recorded on Reef 13-124 and Reef 13-121 (Table 1). Cover on Reef 13-124 had declined from high to moderate levels likely due to COTS feeding activity. There has been a considerable period since the outer-shelf reefs of the Princess Charlotte Bay sector were last surveyed (8-14 years). Over this period coral cover on all outer-reefs in the Princess Charlotte Bay sector has increased. However COTS outbreaks have occurred on these outer reefs previously. Given that COTS numbers have increased on a nearby mid-shelf reef in recent years, the narrow width of the continental shelf and the proximity of these outer-shelf reefs to mid-shelf reefs, it is possible that COTS may become more prevalent on these reefs in the future.
Table 1. Summary of manta tow survey results for the Princess Charlotte Bay sector.
|
Reef |
Shelf Position |
Tows |
COTS |
COTS per tow |
Median % Live Coral Cover |
Median % Dead Coral Cover |
Median % Soft Coral Cover |
Reef Status |
|
Outer |
44 |
0 |
0 |
40 to 50 |
0 to 5 |
0 to 5 |
NO |
|
|
Outer |
34 |
0 |
0 |
20 to 30 |
0 to 0 |
0 to 5 |
NO |
|
|
Outer |
37 |
0 |
0 |
30 to 40 |
0 to 5 |
0 to 5 |
NO |
|
|
Outer |
45 |
0 |
0 |
30 to 40 |
0 to 5 |
0 to 5 |
RE |
|
|
Mid |
63 |
26 |
0.41 |
20 to 30 |
0 to 5 |
0 to 5 |
IO |
|
|
Overall GBR average for last survey - visit 21 |
All |
0.22 |
10 to 20 |
0 to 5 |
0 to 5 |
- |
||
|
Average last survey - visit 21 |
Mid |
0.02 |
10 to 20 |
0 to 5 |
0 to 5 |
- |
||
|
Average last survey - visit 21 |
Outer |
0.07 |
10 to 20 |
0 to 5 |
0 to 5 |
- |
||
|
Long-term average value |
Mid |
|
|
0.06 |
10 to 20 |
0 to 5 |
5 to 10 |
- |
|
Long-term average value |
Outer |
|
|
0.11 |
20 to 30 |
0 to 5 |
5 to 10 |
- |
|
Long-term average value |
All |
|
|
0.24 |
10 to 20 |
0 to 5 |
5 to 10 |
- |
Cooktown-Lizard Island Sector
The COTS population in the Cooktown-Lizard sector has shown a sharp increase in recent years and remains at historically high levels (Figure 1). Manta tow surveys in 2015 recorded Active Outbreaks of COTS on 8 of 13 mid-shelf reefs surveyed (Table 2), five more than the previous survey. One reef (MacGillivray) had an Incipient Outbreak. Four mid-shelf reefs (Lizard, North Direction, South Direction, and Eyrie) had low or no COTS recorded so were considered to be recovering (Table 2). However these reefs were also affected by damage attributed to Tropical Cyclone Ita. Damage from Cyclone Ita including toppling of massive Porites spp. bommies, scouring and re-assortment of rubble banks was particularly evident on several reefs near the eye of the storm.
No COTS were observed on outer-shelf reefs that generally had moderate coral cover. COTS populations had increased on 7 mid-shelf reefs (15-077, Eye, Helsdon, MacGillivray, Marx, Startle East and Swinger) since they were last surveyed in 2013 and had declined on 6 (Eyrie, Forrester, Irene, Lizard Island, North Direction Island and South Direction Island). The decline of COTS on Irene Reef may have been due to COTS control by the Association of Marine Park Tourism Operators (AMPTO). Reduced numbers of COTS on the other 5 reefs was likely due to a lack of coral to feed on either due to ongoing unsustainably high COTS densities or from the effects of Tropical Cyclone Ita or both. With the exception of Irene Reef all reefs where COTS numbers had declined were near the recorded track of Cyclone Ita and recent cyclone damage was observed on all these reefs
Figure 1. Gross change in COTS numbers (i.e. average number of COTS recorded during each two-minute manta tow) through time as recorded from surveys of reefs in the Cooktown-Lizard Island sector by the LTMP.
Eleven out of 22 reefs had low coral cover (0-10%) including 8 mid-shelf reefs and 3 outer-shelf reefs. Eight reefs had moderate coral cover (10-30%), including 3 mid-shelf reefs and 5 outer-shelf reefs. High coral cover (30-50%) was only observed on Harrier Reef, an outer-shelf reef. Declines in coral cover were observed for the majority (16) of reefs in this sector. The declines in hard coral for the majority of these reefs were due to COTS feeding activity, Tropical Cyclone Ita or a combination of the two disturbances. Increases in hard coral cover were observed at Harrier Reef, Ribbon No. 3 Reef and Ribbon No. 6 Reef. Three reefs (Reef 15-077, Carter Reef and Irene Reef) showed no change in coral cover. Compared to the previous survey in October 2012, coral cover for the mid-shelf intensive survey reefs had declined, while coral cover on outer-shelf reefs was similar to or lower than that recorded in the previous survey and had few tabulate corals that likely reflected the impact of Cyclone Ita. While no inshore reefs were manta towed, coral cover had plummeted on the fixed survey sites. This was also presumably due to the combined effects of COTS feeding activity and cyclonic wave action.
Table 2. Summary of manta tow survey results for the Cooktown-Lizard Island sector.
|
Reef |
Shelf Position |
Tows |
COTS |
COTS per tow |
Median % Live Coral Cover |
Median % Dead Coral Cover |
Median % Soft Coral Cover |
Reef Status |
|
Mid |
18 |
12 |
0.67 |
5 to 10 |
0 to 5 |
0 to 5 |
IO |
|
|
Mid |
85 |
8 |
0.09 |
0 to 5 |
0 to 0 |
0 to 5 |
RE |
|
|
Mid |
73 |
6 |
0.08 |
0 to 5 |
0 to 0 |
0 to 5 |
RE |
|
|
Mid |
22 |
40 |
1.82 |
0 to 5 |
0 to 5 |
0 to 5 |
AO |
|
|
Mid |
52 |
79 |
1.52 |
5 to 10 |
0 to 5 |
0 to 5 |
AO |
|
|
Mid |
18 |
0 |
0 |
0 to 5 |
0 to 5 |
0 to 5 |
RE |
|
|
SOUTH DIRECTION ISLAND(B) |
Mid |
37 |
1 |
0.03 |
0 to 5 |
0 to 5 |
0 to 5 |
RE |
|
Mid |
61 |
79 |
1.3 |
0 to 5 |
0 to 5 |
0 to 5 |
AO |
|
|
Mid |
31 |
77 |
2.48 |
5 to 10 |
0 to 5 |
0 to 5 |
AO |
|
|
Mid |
39 |
85 |
2.18 |
0 to 5 |
0 to 5 |
0 to 5 |
AO |
|
|
Mid |
16 |
24 |
1.5 |
10 to 20 |
0 to 5 |
0 to 5 |
AO |
|
|
Mid |
41 |
89 |
2.17 |
10 to 20 |
0 to 5 |
0 to 5 |
AO |
|
|
Mid |
56 |
32 |
0.57 |
10 to 20 |
0 to 5 |
5 to 10 |
AO |
|
|
Outer |
59 |
0 |
0 |
10 to 20 |
0 to 0 |
0 to 5 |
NO |
|
|
Outer |
96 |
0 |
0 |
5 to 10 |
0 to 0 |
0 to 5 |
NO |
|
|
Outer |
84 |
0 |
0 |
5 to 10 |
0 to 0 |
0 to 5 |
NO |
|
|
Outer |
54 |
0 |
0 |
5 to 10 |
0 to 0 |
0 to 5 |
NO |
|
|
Outer |
16 |
0 |
0 |
30 to 40 |
0 to 5 |
0 to 5 |
NO |
|
|
Outer |
55 |
0 |
0 |
20 to 30 |
0 to 0 |
0 to 5 |
NO |
|
|
Outer |
61 |
0 |
0 |
20 to 30 |
0 to 5 |
0 to 5 |
NO |
|
|
Outer |
31 |
0 |
0 |
10 to 20 |
0 to 0 |
0 to 5 |
NO |
|
|
Outer |
44 |
0 |
0 |
10 to 20 |
0 to 0 |
0 to 5 |
NO |
|
|
Overall GBR average for last survey – 2013 |
All |
0.22 |
10 to 20 |
0 to 5 |
0 to 5 |
- |
||
|
Long-term average value |
Inshore |
0.14 |
20 to 30 |
0 to 5 |
0 to 5 |
- |
||
|
Long-term average value |
Mid |
0.18 |
10 to 20 |
0 to 5 |
0 to 5 |
- |
||
|
Long-term average value |
Outer |
0 |
10 to 20 |
0 to 5 |
0 to 5 |
- |
||
|
Average last survey – 2013 |
Inshore |
1.08 |
30 to 40 |
0 to 5 |
0 to 5 |
- |
||
|
Average last survey – 2013 |
Mid |
0.84 |
10 to 20 |
0 to 5 |
0 to 5 |
- |
||
|
Average last survey – 2013 |
Outer |
0 |
10 to 20 |
0 |
0 to 5 |
- |
Table 3. Summary of scuba search survey results for Cooktown-Lizard sector.
|
Reef |
Shelf Position |
COTS (<5cm) |
COTS (>5cm) |
COTS (>15cm) |
COTS (>25cm) |
WS |
BBD |
BrB |
SEB |
Drupella |
|
I |
0 |
0 |
0 |
0 |
3 |
0 |
0 |
3 |
0 |
|
|
I |
0 |
0 |
0 |
0 |
0 |
0 |
0 |
2 |
10 |
|
|
M |
0 |
0 |
0 |
1 |
0 |
0 |
0 |
2 |
10 |
|
|
M |
0 |
0 |
2 |
2 |
1 |
0 |
0 |
3 |
19 |
|
|
M |
0 |
0 |
0 |
0 |
6 |
0 |
1 |
4 |
62 |
|
|
O |
0 |
0 |
0 |
0 |
3 |
0 |
1 |
1 |
15 |
|
|
O |
0 |
0 |
0 |
0 |
4 |
1 |
1 |
4 |
2 |
|
|
O |
0 |
0 |
0 |
0 |
5 |
1 |
0 |
0 |
10 |
|
|
Overall GBR Average for last survey – 2013 |
All |
0.15 |
1.1 |
2.2 |
1.2 |
5.4 |
0.085 |
2.7 |
2.4 |
11 |
|
Long term average |
I |
0.19 |
1.3 |
2.4 |
2.4 |
7.7 |
0.21 |
1.6 |
9.4 |
22 |
|
Long term average |
M |
0.059 |
0.24 |
2.1 |
1.6 |
4.4 |
0.084 |
1.2 |
6.2 |
46 |
|
Long term average |
O |
0 |
0.041 |
0.02 |
0 |
25 |
0.25 |
1.8 |
1.9 |
14 |
|
Average for last survey -2013 |
I |
2 |
11 |
18 |
11 |
1.5 |
0 |
2 |
18 |
9.5 |
|
Average for last survey - 2013 |
M |
0 |
0.67 |
4.3 |
4.3 |
7.3 |
0.33 |
4.3 |
4.7 |
37 |
|
Average for last survey - 2013 |
O |
0 |
0 |
0.33 |
0 |
7.7 |
0 |
2.7 |
1.3 |
11 |
WS= White syndrome, BBD = black band syndrome, BrB = brown band disease, SEB= skeletal eroding band disease
Scuba search surveys on 8 reefs in this sector revealed few agents of coral mortality and COTS numbers had declined considerably on intensive survey sites since 2013. In total 5 COTS were recorded on 2 mid-shelf reefs. This was in stark contrast to the previous survey where a total of 110 COTS were recorded on 6 of the 8 reefs. Additionally, COTS scars were seen on 3 mid-shelf reefs and 1 outer-shelf reef, where COTS had been recorded previously. No COTS were observed on the 2 inshore reefs (Martin and Linnet) surveyed. For both these reefs COTS had been at outbreak levels in 2013 causing localised declines in coral cover. The low number of COTS seen on these 2 reefs during recent surveys appeared linked to the reduced amount of live coral following Cyclone Ita that passed almost directly over most of the scuba survey reefs in April 2014.
References
AIMS (Australian Institute of Marine Science) 2014. Maximum Wind Speed 10 minutes, Wind direction (Scalar Average 10 minutes) at Lizard Island. http://data.aims.gov.au/aimsrtds/datatool.xhtml?from=2014-04-11&thru=2014-04-12&channels=3491,3485


