Dates: 8th – 30th October 2012
Vessel: MV Floreat
Survey leader: Kerryn Johns
Summary
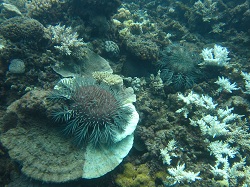
Twenty-two reefs in the Cooktown-Lizard Island sector were surveyed for live coral cover and crown-of-thorns starfish (COTS) using manta tow. Intensive scuba surveys of benthic organisms, reef fishes and agents of coral mortality (scuba searches) were also completed at permanent survey sites on eight of these reefs. These surveys found high densities of COTS on the great majority of inshore and mid-shelf reefs, though they have not yet reduced the coral cover on most reefs. Preliminary results of the manta tow surveys and SCUBA searches are presented in this report.
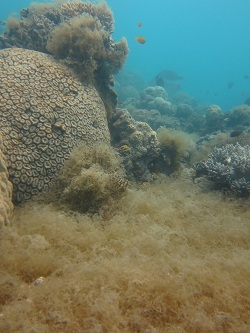
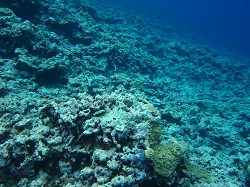
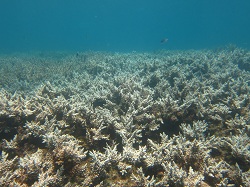
COTS populations were recorded at outbreak levels on 16 of the 22 reefs that were surveyed using manta tow. COTS were observed on all inshore and midshelf reefs that were surveyed, and all but one had populations at outbreak levels. Five reefs were classified as Active Outbreaks (AO) while 11 were classified as Incipient Outbreaks (IO). No COTS were observed on any of the five outer-shelf reefs that were surveyed using manta tow. Dead coral cover was higher than normal on several reefs that were affected by outbreak levels of COTS. There were also large numbers of long-dead coral skeletons that were overgrown by well-established turf algae communities, particularly at reefs with active outbreaks, indicating that COTS had been active for a long period of time.
COTS were also recorded, often in high numbers, during scuba search surveys on six of the eight intensive survey reefs including one outer-shelf reef. Records of scars from COTS feeding activity at reefs with localized outbreaks (>7 COTS across three survey sites) were very high compared with previous surveys. COTS recorded during scuba searches spanned all class sizes, with starfish 15-24cm diameter being the most common. This suggests that current populations on reefs in this sector are the result of multiple recruitment events. Further, in combination with estimates of the size of starfish from manta tow surveys; this also suggests that a large number of recruits from the past two to three years are just beginning to mature.
Hard coral cover was moderate (10-30%) at the majority of survey reefs. High coral cover (30-50%) was recorded at 4 of 22 reefs while low coral cover (5-10%) was recorded from only one reef. Coral cover was the same as in the previous survey for the majority (15) of locations. Coral cover had declined by more than 5% since the last survey at five reefs, however some of these had not been surveyed for more than two years, making it difficult to compare patterns of growth and decline. Coral cover increased since the last survey at only two locations, both of which were previously classified as recovering from COTS outbreaks.
Signs of white syndrome disease were rare or absent during scuba searches. This was a decrease from low levels recorded at some locations in 2010. Numbers of Drupella spp. (coral feeding snails) were variable, but generally low relative to historical records.
A summary of the results is presented in Tables 1 and 2. The monitoring program design and sampling methods and an explanation of the COTS outbreak terminology can be found on the AIMS reef monitoring website: internal:/docs/research/monitoring/reef/reef-monitoring.html
Reef-wide COTS surveys
There has been a rapid buildup of COTS activity on reefs in this sector (Figure 1). Active outbreaks (>1.0 COTS per two minute tow, meaning that COTS feeding activity is almost certain to reduce coral cover) were recorded at Two Isles Reef, Forrester Reef, Startle East Reef, Irene Reef and South Direction Island Reef. These included both inshore and mid-shelf reefs. The highest density of COTS was observed at Two Isles Reef (mean of 2.7 COTS per tow). Eleven reefs in 2012 were classified as ‘Incipient Outbreaks' (between 0.22 – 1.0 COTS per tow). Incipient outbreak densities mean that COTS activity is likely to reduce coral cover substantially in the future. All outer-shelf reefs and one mid-shelf reef (Reef 15-047) were classified as ‘No Outbreak'. Startle-East was the only reef of those surveyed in 2012 that had a recorded COTS outbreak (Incipient) at the previous survey. The status of the majority of the reefs at the previous survey was ‘No Outbreak', though some reefs (Eyrie, Irene, Ribbon #6 and Three Isles) had not been surveyed within the previous five years. Three reefs (Helsdon, Lizard Island and MacGillivray) were still classified as ‘Recovering' from a previous outbreak when last surveyed in 2010.
Low but gradually increasing numbers of COTS have been recorded on reefs in the Cooktown-Lizard Is sector since 2006. Observations at the start of the previous wave of outbreaks (1994 on) suggested that numbers build up on reefs in this region over a number of years until populations reach densities that produce very large numbers of larvae that colonize and reach outbreak densities on reefs immediately to the south. This now appears to be occurring with numbers of COTS observed already greater than those recorded during the nineties. Furthermore, the large proportion of relatively small starfish recorded suggests that the populations on these reefs will continue to increase in the next few years, which will result in a substantial loss of coral from present levels, and the likely initiation of a wave of outbreaks that will pass southwards through the central GBR over the next decade.
![]()
Figure 1. Average crown-of-thorns starfish densities (starfish recorded per 2 minute manta tow) on survey reefs in the Cooktown – Lizard Island sector for Inner (I), Mid (M) and Outer (O) shelf reefs. The threshold for Incipient Outbreak status is a mean 0.22 starfish per tow on a reef. * No reefs were surveyed in 2012.
Reef-wide coral cover
Moderate coral cover (10-30%) was recorded at 17 of the 22 reefs that were surveyed. Coral cover was high (30-50%) at Linnet Reef, Two Isles, Three Isles and MacGillivray Reef, though all these reefs had outbreaking COTS populations (Table 1). Carter Reef was the only reef with low hard coral cover of 5-10%, a decline from 20-30% cover in 2011. The extended period between surveys make it difficult to identify a cause for this decline in coral cover, though there have been a number of storms in intervening years. In addition to Carter Reef, hard coral cover declined by more than 5% since the previous survey (where survey interval was less than 5 years) at Reef 15-034, Forrester Reef, Martin Reef and Two Isles. COTS feeding activity is the likely cause of declines in each case, except for Reef 15-034, an outer-shelf reef where no COTS were observed during manta tow. Conversely, hard coral increased by more than 5% at Helsdon Reef and MacGillivray Reef, both of which were recovering from previous COTS outbreaks. For the remaining 15 reefs, hard coral cover was unchanged from the previous survey, though survey intervals vary from 2 - 10 years and it is not known how coral cover may have varied over this time. The population boom of COTS in this region is relatively recent and there is likely to be a lag before coral cover declines markedly; this should be evident in the next round of surveys in two years time.
Table 1. Summary of manta tow survey results for the Cooktown-Lizard Island sector.
|
Reef |
Shelf Position |
Tows |
COTS |
COTS per tow |
Median % Live Coral Cover |
Median % Dead Coral Cover |
Median % Soft Coral Cover |
Reef Status |
|
Inner |
67 |
34 |
0.51 |
20 to 30 |
0 to 5 |
0 to 5 |
IO |
|
|
Inner |
35 |
34 |
0.97 |
30 to 40 |
0 to 5 |
0 to 5 |
IO |
|
|
Inner |
25 |
69 |
2.76 |
30 to 40 |
0 to 5 |
0 to 5 |
AO |
|
|
Inner |
26 |
12 |
0.46 |
40 to 50 |
0 to 5 |
0 to 5 |
IO |
|
|
Inner |
73 |
50 |
0.68 |
20 to 30 |
0 to 5 |
0 to 5 |
IO |
|
|
Mid |
19 |
5 |
0.26 |
30 to 40 |
0 to 5 |
0 to 5 |
IO |
|
|
Mid |
86 |
64 |
0.74 |
10 to 20 |
0 to 5 |
0 to 5 |
IO |
|
|
Mid |
67 |
57 |
0.85 |
20 to 30 |
0 to 5 |
0 to 5 |
IO |
|
|
Mid |
48 |
46 |
0.96 |
20 to 30 |
0 to 5 |
0 to 5 |
IO |
|
|
Mid |
21 |
15 |
0.71 |
20 to 30 |
0 to 5 |
0 to 5 |
IO |
|
|
Mid |
45 |
55 |
1.22 |
10 to 20 |
0 to 5 |
0 to 5 |
AO |
|
|
Mid |
73 |
152 |
2.08 |
10 to 20 |
0 to 5 |
0 to 5 |
AO |
|
|
Mid |
32 |
15 |
0.47 |
20 to 30 |
0 to 5 |
0 to 5 |
IO |
|
|
Mid |
40 |
49 |
1.23 |
10 to 20 |
0 to 5 |
0 to 5 |
AO |
|
|
Mid |
48 |
5 |
0.1 |
10 to 20 |
0 to 5 |
0 to 5 |
NO |
|
|
Mid |
41 |
15 |
0.37 |
10 to 20 |
0 to 5 |
0 to 5 |
IO |
|
|
Mid |
55 |
62 |
1.13 |
10 to 20 |
0 to 5 |
0 to 5 |
AO |
|
|
Outer |
81 |
0 |
0 |
5 to 10 |
0 to 0 |
0 to 5 |
NO |
|
|
Outer |
81 |
0 |
0 |
10 to 20 |
0 to 0 |
0 to 5 |
NO |
|
|
Outer |
54 |
0 |
0 |
10 to 20 |
0 to 5 |
0 to 5 |
NO |
|
|
Outer |
61 |
0 |
0 |
10 to 20 |
0 to 0 |
0 to 5 |
NO |
|
|
Outer |
32 |
0 |
0 |
10 to 20 |
0 to 5 |
0 to 5 |
NO |
|
|
Overall GBR average for 2011 |
All |
|
|
0.02 |
10 to 20 |
0 to 5 |
0 to 5 |
- |
|
Long-term average value |
Inner |
|
|
0.14 |
20 to 30 |
0 to 5 |
0 to 5 |
- |
|
Long-term average value |
Mid |
|
|
0.14 |
10 to 20 |
0 to 5 |
0 to 5 |
- |
|
Long-term average value |
Outer |
|
|
0 |
10 to 20 |
0 to 5 |
0 to 5 |
- |
|
Average last survey – 2011 |
Inner |
|
|
0.02 |
30 to 40 |
0 to 5 |
0 to 5 |
- |
|
Average last survey – 2011 |
Mid |
|
|
0.1 |
10 to 20 |
0 to 5 |
0 to 5 |
- |
|
Average last survey – 2011 |
Outer |
|
|
0 |
10 to 20 |
0 to 5 |
0 to 5 |
- |
Intensive SCUBA surveys of agents of coral mortality
Localised active outbreaks of COTS as defined for scuba search surveys (>7 COTS across three survey sites) were recorded at Martin Reef, Linnet Reef, Lizard Island and North Direction Island. The highest COTS count was 48 starfish at Martin Reef (Table 2). COTS numbers at each location are likely to be an under-estimate, as COTS feeding scars were often observed without finding an associated starfish. All class sizes were present and there was no doubt that numbers of small and cryptic individuals remained hidden, particularly amongst stands of bottlebrush Acropora spp. COTS were also observed at MacGillivray Reef but at less than outbreak levels, and a single COTS was recorded on the survey sites of Carter Reef, an outer-shelf reef and Preservation Zone. COTS were present in much lower numbers at each of these locations in the previous survey in 2011 (with the exception of Carter Reef) and much lower numbers of feeding scars were also recorded.
Incidence of White Syndrome coral disease seen in scuba searches (Table 2) was generally low. In most cases there was a decrease from the low levels observed in 2011. Skeletal Eroding Band disease (SEB) was observed at or below the long term average at most locations. Temporal patterns in incidence of SEB were inconsistent among locations. It is uncertain what densities of infected colonies lead to significant coral mortality. Low numbers of corallivorous snails, Drupella spp., were found on every survey reef. 527 snails per hectare were recorded for North Direction Island, but this density is still reasonably low compared with some historical records. There was no clear spatial pattern in Drupella spp. numbers among reefs in this year's survey, nor was there a trend compared with previous surveys.
Table 2. Summary of SCUBA search survey results for the Cooktown-Lizard Island sector.
|
Reef |
Shelf Position |
COTS (<5cm) |
COTS (>5cm) |
COTS (>15cm) |
COTS (>25cm) |
WS |
BBD |
BrB |
SEB |
Drupella |
|
I |
1 |
9 |
23 |
15 |
3 |
0 |
3 |
22 |
1 |
|
|
I |
3 |
12 |
12 |
6 |
0 |
0 |
1 |
13 |
18 |
|
|
M |
0 |
0 |
1 |
1 |
0 |
0 |
0 |
0 |
24 |
|
|
M |
0 |
1 |
10 |
6 |
14 |
0 |
1 |
1 |
9 |
|
|
M |
0 |
1 |
2 |
6 |
8 |
1 |
12 |
13 |
79 |
|
|
O |
0 |
0 |
1 |
0 |
8 |
0 |
2 |
1 |
18 |
|
|
O |
0 |
0 |
0 |
0 |
5 |
0 |
2 |
2 |
4 |
|
|
O |
0 |
0 |
0 |
0 |
10 |
0 |
4 |
1 |
11 |
|
|
Overall GBR Average for – 2011 |
All |
0 |
0.021 |
0.11 |
0.34 |
7 |
0.064 |
3.6 |
2.7 |
11 |
|
Long term average |
I |
0.2 |
1.4 |
2.6 |
3 |
8.3 |
0.23 |
1.9 |
10 |
24 |
|
Long term average |
M |
0.063 |
0.25 |
2.2 |
1.8 |
4.6 |
0.092 |
1.4 |
6.6 |
47 |
|
Long term average |
O |
0 |
0.043 |
0.022 |
0 |
26 |
0.21 |
2 |
1.9 |
15 |
|
Average for last survey – 2011 |
I |
0 |
0.5 |
2 |
1.5 |
31 |
0 |
3.5 |
5.5 |
14 |
|
Average for last survey – 2011 |
M |
0 |
0 |
0.33 |
1.7 |
8 |
0 |
1.3 |
16 |
18 |
|
Average for last survey - 2011 |
O |
0 |
0 |
0 |
0 |
23 |
0 |
4.3 |
2 |
29 |
WS = White Syndrome, BBD = Black Band Disease, BrB = Brown Band Disease, SEB = Skeletal Eroding Band Disease.
References
English, S., Wilkinson, C. and Baker, V. (1997) Survey Manual for Tropical Marine Resources (2ndEdition). Australian Institute of Marine Science. Townsville.
This project is partially supported by the Marine and Tropical Sciences Research Facility
For further information contact
Dr. Hugh Sweatman , AIMS
Telephone: +61 7 4753 4470
Fax: +61 7 4753 4288
Email: h.sweatman@aims.gov.au


