Summary
- Overall, coral cover declined on reefs in this sector.
- Declines in coral cover were due to the ongoing effects of crown-of-thorns starfish (COTS) and coral bleaching in previous years.
- Counts of COTS, and the proportion of reefs in the sector affected by COTS both increased.
Figure 1: Map showing location of reefs in the Townsville sector. Click on figure to go to AIMS Spatial Maps for information on individual reefs.
Table 1: Overview of the results obtained from manta tow surveys of reefs in the Townsville sector.
| Townsville Sector | Summary | Trend since last survey |
|---|---|---|
| Median Coral Cover | Moderate (10-30%) | Decreased |
| COTS status: | 1 Active Outbreaks, 1 Incipient Outbreaks | Increased |
| Coral bleaching: | Low | Decreased |
As part of the Long Term Monitoring Program (LTMP), surveys of coral cover and the abundance of the coral feeding crown-of-thorns starfish (COTS), Acanthaster cf. solaris* on eleven reefs in the Townsville sector of the Great Barrier Reef (GBR) were completed using the manta tow technique. Preliminary results of the manta tow surveys are presented in Tables 1 and 2. These show that the overall median sector-wide live coral cover for the sector was moderate (10 to 20%) but had declined since last year (20-30%). Median reef-wide live coral cover (coral cover) had increased at four reefs: Fore and Aft, Helix, Roxburgh and Fork, since previous surveys (Table 2). There was a decrease in hard coral cover on four reefs: Centipede, Little Kelso, Rib and Knife. In the absence of COTS, declines in coral cover on Centipede and Fork reefs was likely due to coral bleaching that affected reefs in the sector during the summers of the 2016 and 2017 survey years. Declines in coral cover on Little Kelso Reef and Rib Reef were largely caused by high densities of COTS, although there was probably also some mortality due to recent coral bleaching events, especially in 2017. Coral cover remained stable on Grub, Kelso, and Chicken Reefs. The slow recovery of coral cover on these reefs was likely due to coral bleaching in recent years, though small numbers of COTS (below outbreak levels) were observed on Kelso Reef.
Scuba surveys of fixed transects recorded low levels of coral bleaching on the majority of reefs but in each case, this was limited to a few scattered colonies. No bleaching was recorded on Rib or Roxburgh Reefs. Cases of the coral disease white syndrome were recorded on all reefs except Rib Reef. Greater than normal levels of white syndrome were found on six reefs: Centipede, Chicken, Fore and Aft, Helix, Little Kelso and Lynch’s. Occurrence of three other coral diseases (black-band, brown-band and skeletal eroding band) was generally low except for unusually high levels of skeletal eroding band disease recorded on Helix Reef. The corallivorous snail, Drupella spp. was observed at most reefs; numbers were generally within the range of past values.
Details of the manta tow method can be found in the Standard Operational Procedure No. 9 [AIMS Research - Crown-of-thorns Starfish and Coral Surveys - Standard Operational Procedure 9]. Further details of the monitoring program design, sampling methods and a full explanation of the A. solaris outbreak terminology can be found on the AIMS website.
*Note: genetic studies show that there are at least four species of COTS. These are the North and South Indian Ocean species (A. planci and A. mauritiensis), a Red Sea species (not yet named) and a Pacific species. The range of the Pacific includes the Great Barrier Reef and it has been provisionally named Acanthaster solaris (Haszprunar et. al. 2017).
Table 2: Summary of manta tow surveys of reefs in the Townsville sector. Arrows indicate the trend in live coral cover and A. cf. solaris since last survey; ▲= increase, ▼ = decrease, “ ” = no change.
| Reef | Shelf Position | Tows | Previous survey year | A. solaris | A. solaris per tow | Median Live Coral Cover | Median Soft Coral Cover | Reef Status |
|---|---|---|---|---|---|---|---|---|
| CENTIPEDE | Mid | 58 | 2016 | 1 ▲ | 0.02 | 5-10% ▼ | 0-5% | RE |
| FORE AND AFT | Mid | 53 | 2016 | 1 ▲ | 0.02 | 20-30% ▲ | 0-5% | NO |
| GRUB | Mid | 50 | 2016 | 0 ▼ | 0 | 5-10% | 0-5% | NO |
| HELIX | Mid | 16 | 2016 | 0 | 0 | 30-40% ▲ | 0-5% | NO |
| KELSO | Mid | 59 | 2016 | 3 ▲ | 0.05 | 10-20% | 0-5% | NO |
| LITTLE KELSO | Mid | 30 | 2016 | 16 ▲ | 0.53 | 20-30% ▼ | 0-5% | IO |
| RIB | Mid | 33 | 2017 | 195 ▲ | 5.91 | 5-10% ▼ | 0-5% | AO |
| ROXBURGH | Mid | 21 | 2016 | 0 | 0 | 20-30% ▲ | 0-5% | NO |
| CHICKEN | Outer | 46 | 2017 | 0 | 0 | 10-20% | 0-5% | NO |
| FORK | Outer | 35 | 2016 | 5 ▲ | 0.14 | 20-30% ▲ | 0-5% | NO |
| KNIFE | Outer | 28 | 2016 | 0 | 0 | 10-20% ▼ | 0-5% | NO |
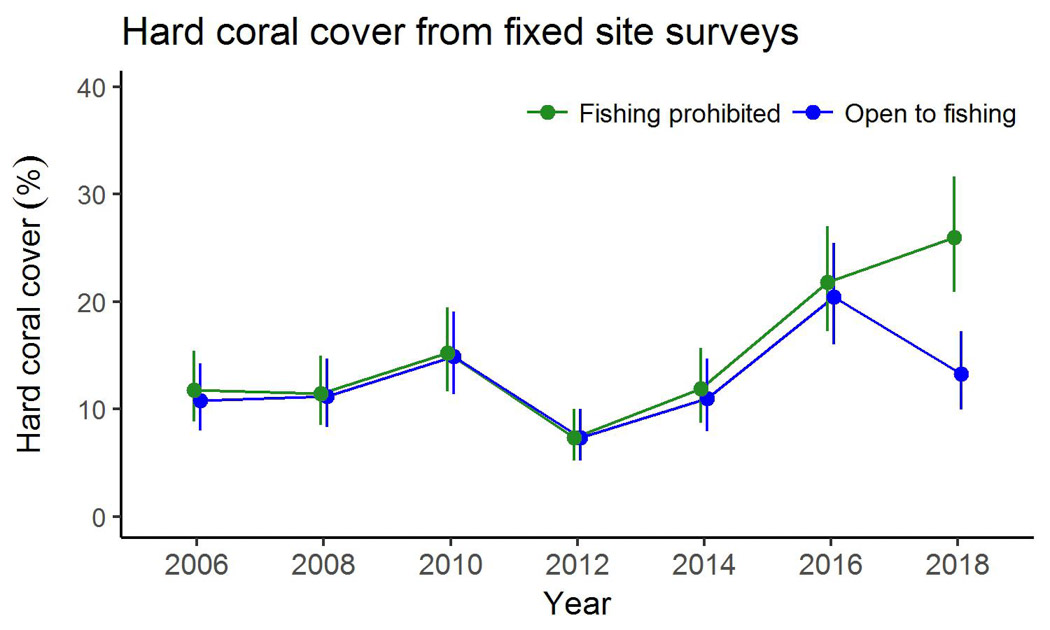
Figure 3: Effects of marine park zoning. Comparisons of the median values of nine variables through time, based on surveys of fixed sites on matched pairs of reefs in this sector. One reef in each pair was rezoned so fishing was prohibited (Green zone) in 2004, the other reef in each pair remains open to fishing (Blue zone). Error bars are 95% credible intervals. Please click on each panel for an enlarged view.
Figure 2: Sector-wide changes in coral cover and the numbers of A. cf. solaris on survey reefs in the Townsville sector of the GBR.
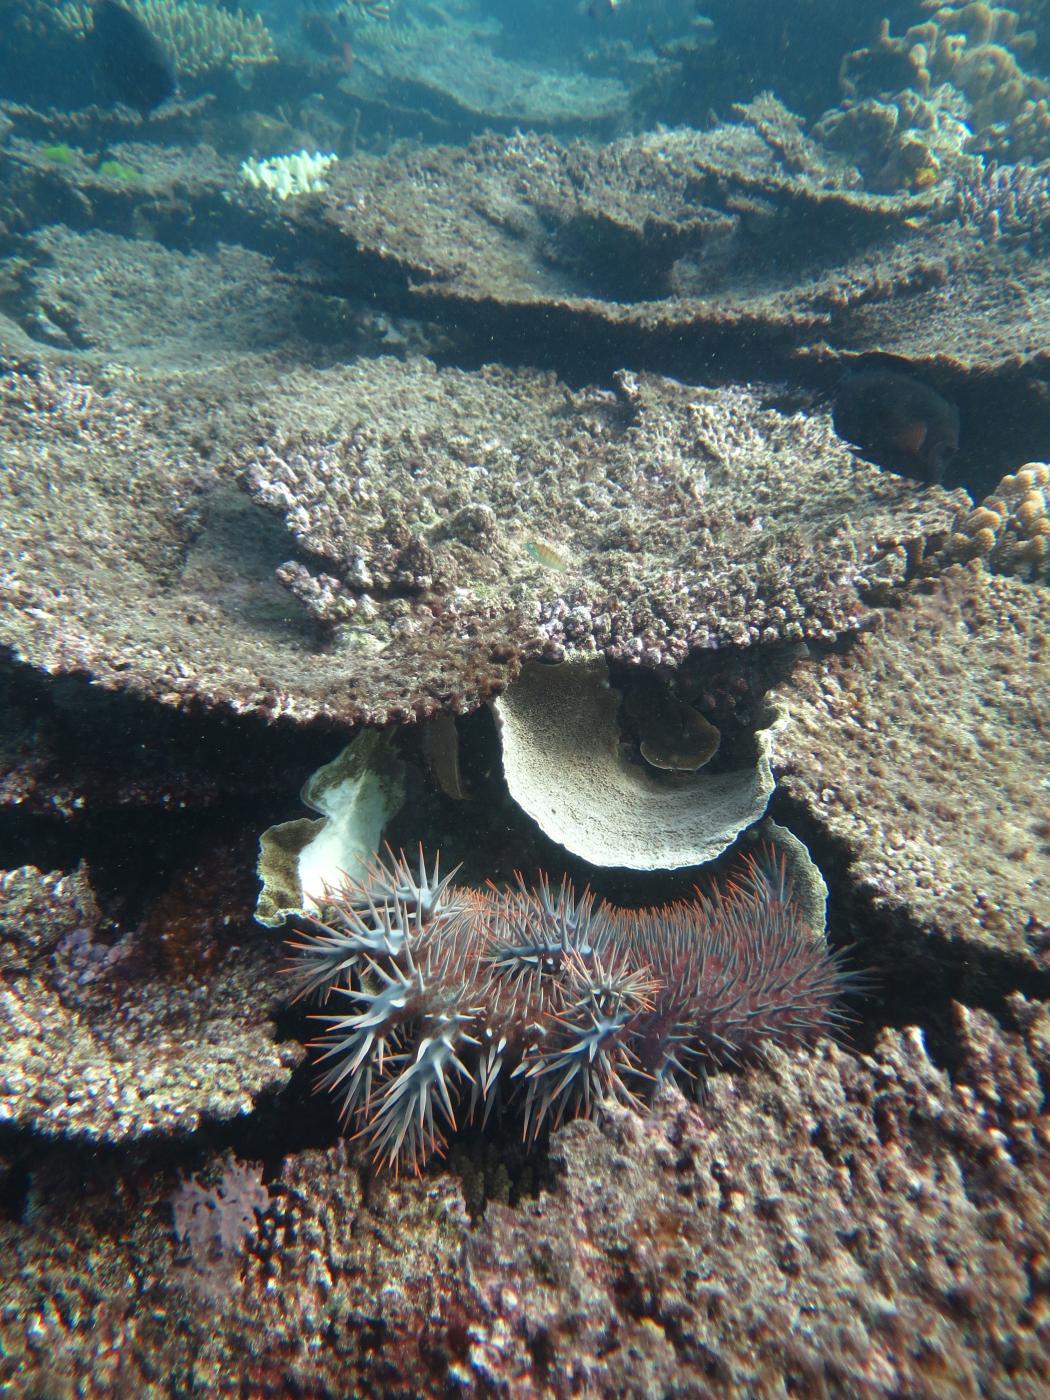
Image 1: High numbers of A. cf. solaris have ravaged large sections of Rib Reef in the Townsville sector.
Image 2: AIMS diver collecting COTS for genetic studies to determine interconnectivity of populations on the north and south of the GBR.
Image 3: Despite the overall decline of coral cover on reefs in this sector some reefs still harboured vibrant coral communities as can be seen in this photo taken on Little Kelso Reef.
Image 4: This tabulate Acropora colony shows classic symptoms of white syndrome disease. This disease was unusually abundant on a number of reefs in this sector.


