Summary
- Overall, coral cover has declined on reefs in this sector.
- Declines in coral cover were due to the combined effects of COTS and cyclones.
- Coral bleaching was limited to scattered individual colonies on fixed transects.
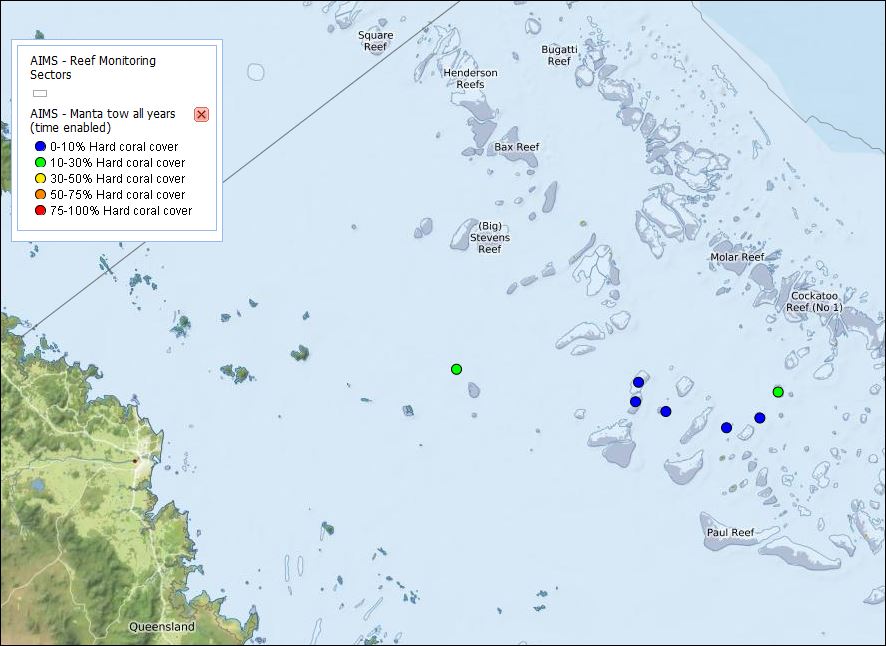
Figure 1: Map showing location of reefs in the Pompey sector. Click on figure to go to AIMS Spatial Maps for information on individual reefs.
Table 1: Overview of the results of manta tow surveys of reefs in the Pompey sector.
| Pompeys Sector | Summary | Trend since last survey |
|---|---|---|
| Median Coral Cover | Low (0-10%) | Decreased |
| COTS status: | 1 Active Outbreaks, 1 Incipient Outbreaks | Increased |
| Coral bleaching: | None | Decreased |
As part of the Long Term Monitoring Program (LTMP), surveys of coral cover and abundance of the coral feeding crown-of-thorns starfish (COTS), Acanthaster cf. solaris* were completed using the manta tow technique on seven reefs in the Pompey sector of the Great Barrier Reef (GBR). Preliminary results of the manta tow surveys are presented in Tables 1 and 2. These show that median sector-wide live coral cover had decreased to low levels (0 to 10%), although more reefs still remain to be surveyed (Table 1). The low coral cover is due to a series of impacts over the last decade. Severe Cyclone Hamish, March 2009, a category 5 system was responsible for widespread decimation of coral cover on reefs in the region. This was followed by Severe Cyclone Marcia a category 4 system that passed through the region in February 2015 that also contributed to the decline in coral cover. Over the same time period time ongoing outbreak levels of COTS on some reefs have continued to affect coral cover in the Pompey sector. Surveys in 2018 showed two reefs, Reef 21-062 and Reef 21-064 had Outbreak levels of COTS. While COTS numbers had decreased on Reef 21-062 since last survey they had increased on Reef 21-064 (Table 2). Live hard coral cover had increased at three reefs and remained stable at one reef (21-060). Coral cover had decreased on three reefs; Reef 21-064 due to COTS and Pompey Reefs 1 and 2 due to the effects of Severe Cyclone Marcia (Table 2).
Scuba surveys on fixed transects recorded low levels of coral bleaching on all reefs, but this was limited to scattered individual colonies. There was evidence of some coral mortality in the relatively recent past in the form of rubble banks and old dead overturned coral colonies, presumably from Severe Cyclone Marcia in February 2015 and ongoing COTS activity. There were cases of white syndrome coral disease on most reefs and incidences were generally at the lower end of the historical range. Incidences of three other coral diseases (black-band, brown-band and skeletal eroding band) were very low. Numbers of the corallivorous snail, Drupella spp. were present at most reefs and were generally at the lower end of the range of abundances recorded previously.
Details of the manta tow method can be found in the Standard Operational Procedure No. 9 [AIMS Research - Crown-of-thorns Starfish and Coral Surveys - Standard Operational Procedure 9]. Further details of the monitoring program design, sampling methods and a full explanation of the A. solaris outbreak terminology can be found on the AIMS website.
*Note: genetic studies show that there are at least four species of COTS. These are the North and South Indian Ocean species (A. planci and A. mauritiensis), a Red Sea species (not yet named) and a Pacific species. The range of the Pacific includes the Great Barrier Reef and it has been provisionally named Acanthaster solaris (Haszprunar et. al. 2017).
Table 2: Summary of manta tow surveys of reefs in the Pompey sector. Arrows indicate the trend in live coral cover and A. cf. solaris since last survey; ▲ = increase, ▼ = decrease, “ ” = no change.
| Reef | Shelf Position | Tows | Previous survey year | A. solaris | A. solaris per tow | Median Live Coral Cover | Median Soft Coral Cover | Reef Status |
|---|---|---|---|---|---|---|---|---|
| 20-353 | Mid | 30 | 2014 | 0 ▼ | 0 | 20-30% ▲ | 0-5% | NO |
| 21-060 | Mid | 18 | 2014 | 0 ▼ | 0 | 0-10% | 0-5% | RE |
| 21-062 | Mid | 39 | 2016 | 9 ▼ | 0.23 | 5-10% ▲ | 0-5% | AO |
| 21-064 | Mid | 25 | 2016 | 13▲ | 0.52 | 0-5% ▼ | 0-5% | IO |
| POMPEY 1 | Mid | 57 | 2014 | 0 | 0 | 5-10% ▼ | 0-5% | NO |
| POMPEY 2 | Mid | 34 | 2014 | 0 | 0 | 5-10% ▼ | 0-5% | NO |
| TERN ISLAND (20309) | Mid | 29 | 2014 | 1 ▲ | 0.03 | 20-30% ▲ | 0-5% | RE |
Figure 3: Effects of marine park zoning. Comparisons of the median values of nine variables through time, based on surveys of fixed sites on matched pairs of reefs in this sector. One reef in each pair was rezoned so fishing was prohibited (Green zone) in 2004, the other reef in each pair remains open to fishing (Blue zone). Error bars are 95% credible intervals. Please click on each panel for an enlarged view.
Figure 2: Sector-wide changes in coral cover and the numbers of A. cf. solaris for survey reefs in the Pompey sector of the GBR.
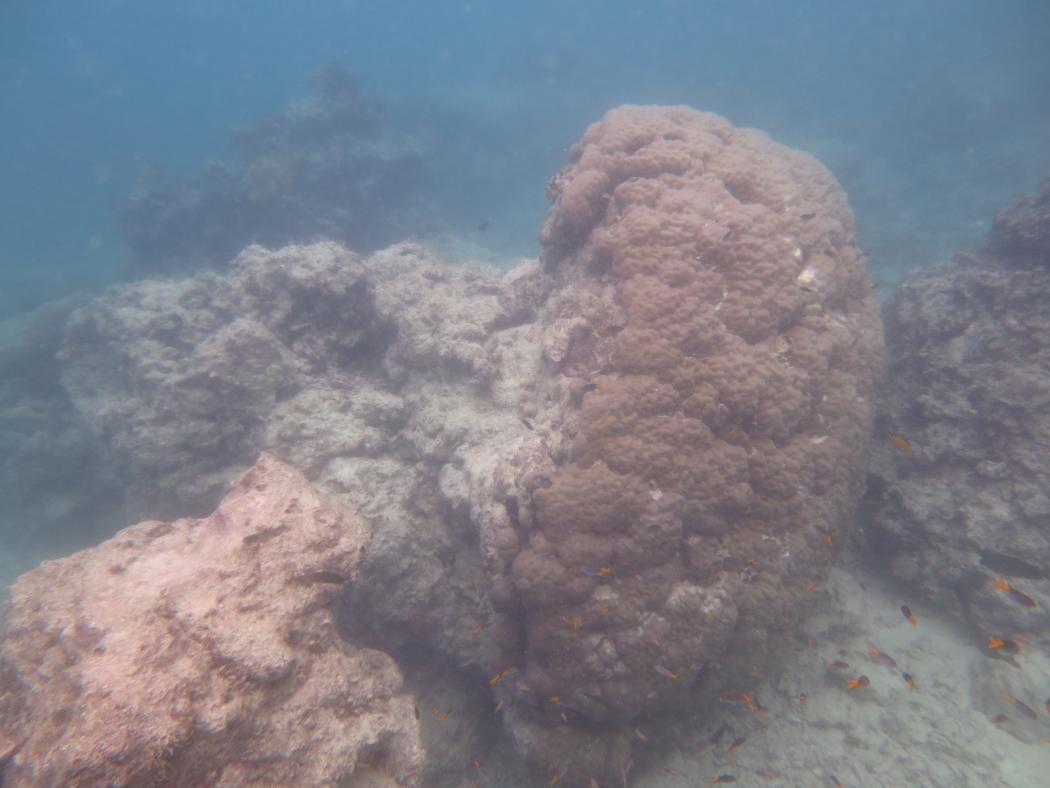
Image 1: Evidence of recent cyclone damage. This giant ‘tooth’ of a massive Porites sp. colony has been uprooted and tumbled down the reef slope.
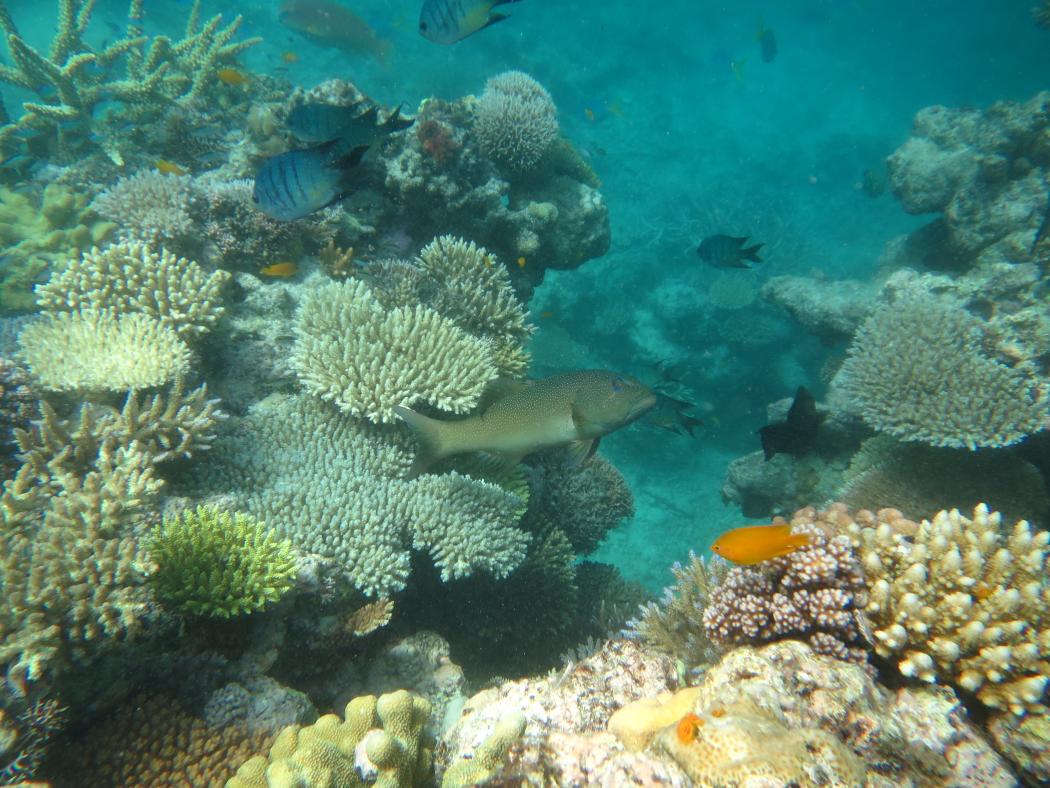
Image 2: While many of the reefs in the Pompeys were heavily degraded, there were still some pockets of healthy coral assemblages.
Image 3: Coral trout, Plectrompous leopardus, were highly abundant on most reefs in the Pompeys


