Summary
- Coral cover increased on three of four reefs surveyed in this sector.
- Coral cover was high (>40%) on all reefs.
- COTS numbers had increased to Incipient Outbreak level at one reef and to low numbers at another.
Hard Coral Cover 0-10% 10-30% 30-50% 50-75% 75-100%
Figure 1: Map showing location of reefs in the Capricorn-Bunker sector.
Table 1: Overview of results obtained from manta tow surveys of reefs in the Capricorn-Bunker sector
| Capricorn Bunkers Sector | Summary | Trend since last survey |
|---|---|---|
| Average Coral Cover (%) | 45.87 | Increased |
| COTS status: | 0 Active Outbreaks, 1 Incipient Outbreaks | Increased |
| Coral bleaching: | Low | Stable |
As part of the Long Term Monitoring Program (LTMP), manta tow surveys of coral cover and the abundance of the coral feeding crown-of-thorns starfish (COTS), Acanthaster cf. solaris* on four reefs in the Capricorn-Bunker sector of the Great Barrier Reef (GBR) were completed. Preliminary results of the manta tow surveys are presented in Tables 1 and 2. The overall median live coral cover for the sector was high (30 to 50%) and had increased since last surveyed (Table 1). Median reef-wide live coral cover (coral cover) had increased at three reefs: Broomfield, Lady Musgrave Is. and One Tree Is. (Table 2). There was a modest decrease in coral cover on one reef, Wreck Is., since 2017, although cover was still high. The cause of this decline is not clear. An increase in COTS numbers on Lady Musgrave Is. Reef to Incipient Outbreak levels had not prevented an increase in reef-wide coral cover as the COTS occurred in localized dense patches. Similar numbers of COTS have been recorded twice since 2013, suggesting that progression to an Active Outbreak will not necessarily occur. Very low numbers of COTS (three individuals) were recorded on One Tree Is. Reef for the first time since manta tow surveys began in 1986. The significance of this, if any, is not yet clear.
Scuba surveys of fixed transects recorded negligible coral bleaching; corals on only one of the 60 transects surveyed (15 per reef) were mildly affected. Cases of the coral disease white syndrome were moderately elevated on all reefs compared to recent years. The occurrence of brown band disease on Lady Musgrave Is. Reef was also higher. However, it is not uncommon for incidence of diseases to increase as coral cover reaches the high levels that were recorded. Occurrence of two other coral diseases (black-band and skeletal eroding band) was low. Numbers of the corallivorous snail, Drupella spp. were very low at all reefs.
Details of the manta tow method can be found in the Standard Operational Procedure No. 9 [AIMS Research - Crown-of-thorns Starfish and Coral Surveys - Standard Operational Procedure 9]. Further details of the monitoring program design, sampling methods and a full explanation of the A. solaris outbreak terminology can be found on the AIMS website.
*Note: genetic studies show that there are at least four species of COTS. These are the North and South Indian Ocean species (A. planci and A. mauritiensis), a Red Sea species (not yet named) and a Pacific species. The range of the Pacific includes the Great Barrier Reef and it has been provisionally named Acanthaster solaris (Haszprunar et. al. 2017).
Table 2: Summary of manta tow surveys of reefs in the Capricorn-Bunker sector. Arrows indicate the trend in live coral cover and A. solaris since last survey; ▲ = increase, ▼ = decrease, " " = no change. Outbreak Status: NO no outbreak, IO incipient outbreak >.22 COTS per tow, RE recovering, AO = Active Outbreak >1 COTS per tow.
| Reef | Shelf Position | Tows | Previous survey year | A. solaris | A. solaris per tow | Live Hard Coral Cover % | Soft Coral Cover % | Survey Year | Reef Status |
|---|---|---|---|---|---|---|---|---|---|
| ONE TREE REEF) | Outer | 76 | 2017 | 3 | 0.04 | 43.43 | 3.94 | 2019 | NO |
| WRECK ISLAND REEF) | Outer | 43 | 2017 | 0 | 0 | 51.15 | 2.32 | 2019 | NO |
| BROOMFIELD REEF) | Outer | 48 | 2018 | 0 | 0 | 52.07 | 2.08 | 2019 | NO |
| LADY MUSGRAVE REEF) | Outer | 55 | 2018 | 21 | 0.38 | 49.1 ▲ | 1.82 | 2019 | IO |
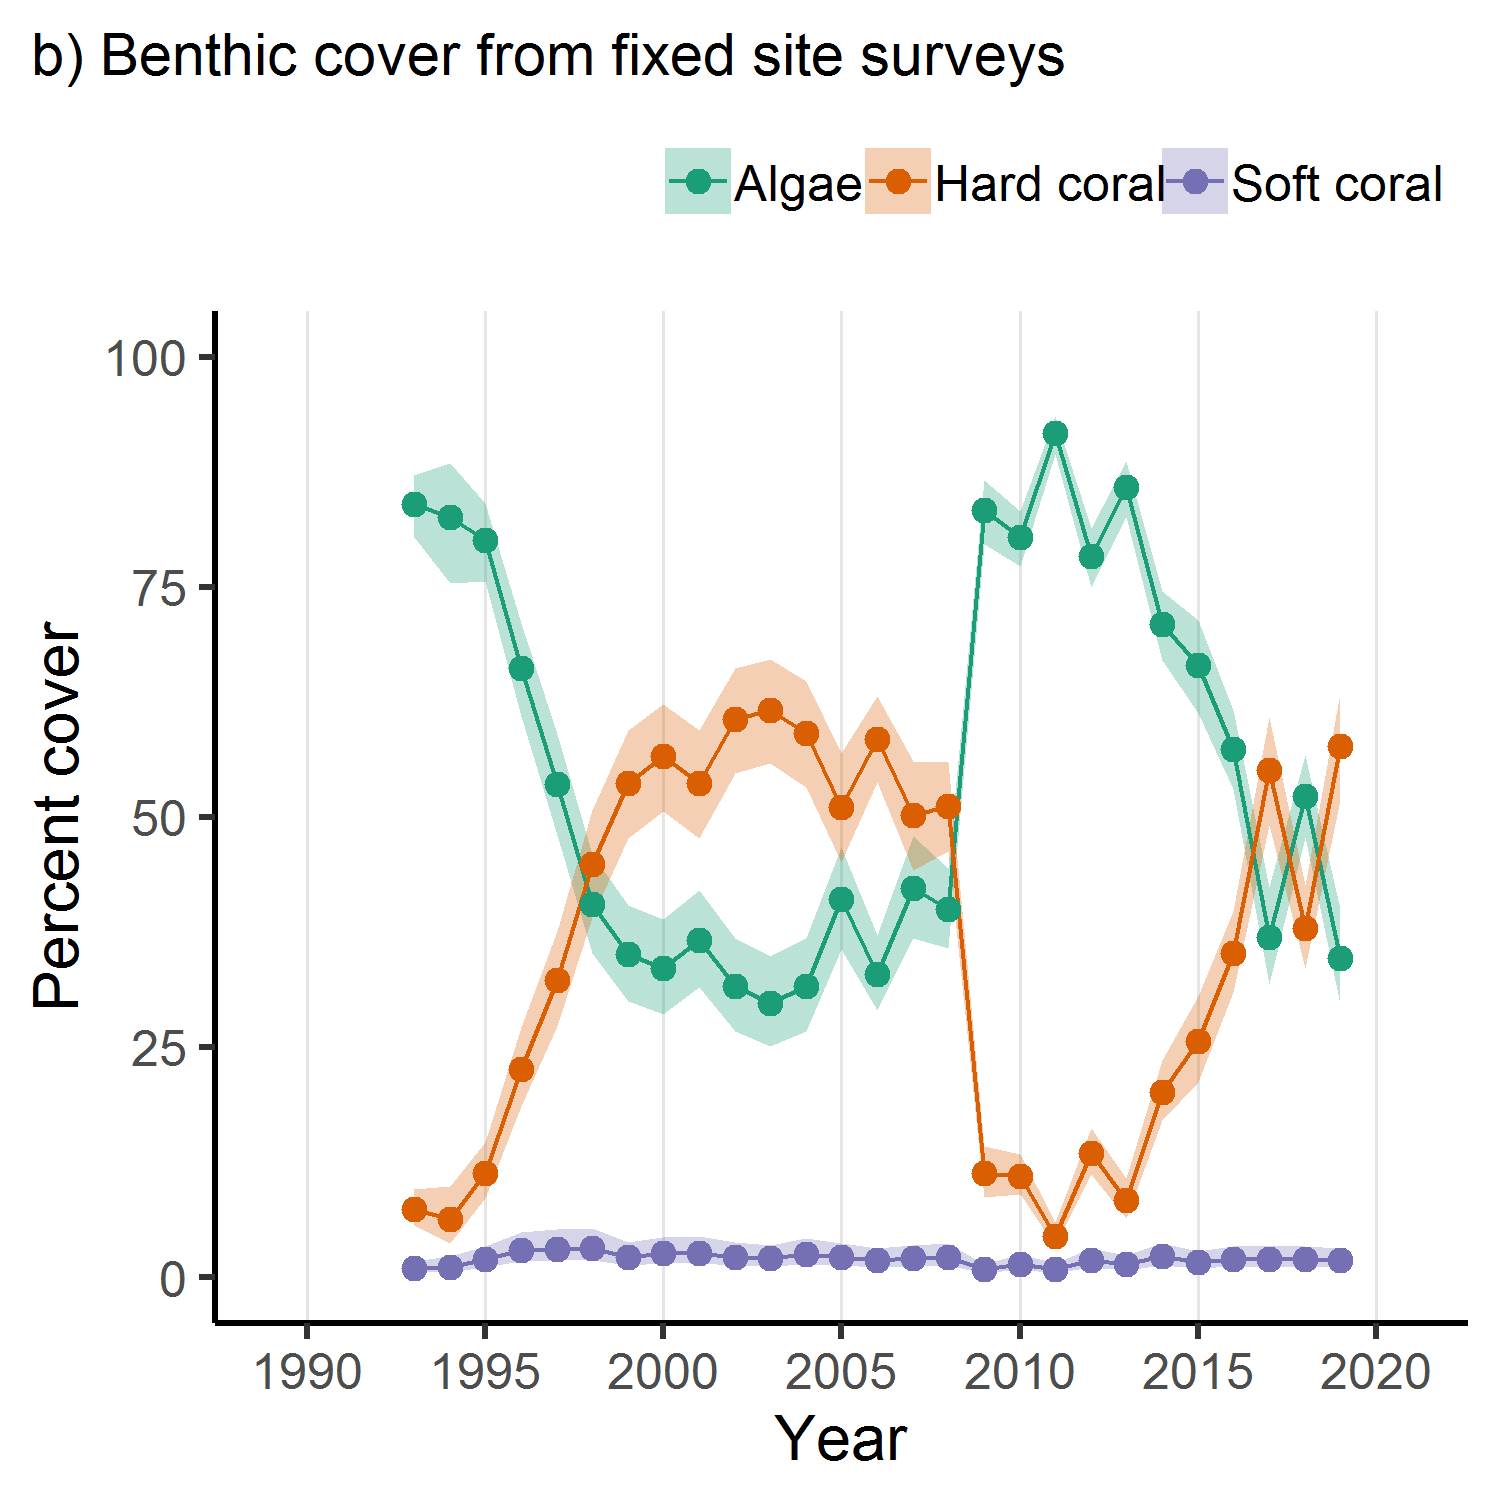
Figure 3: Estimates for benthic data and fish abundance from fixed site surveys. Data are mean estimates ± 95% credible intervals derived from Bayesian hierarchical linear models. Total fish abundance is the combined counts of two groups of fishes that have different maximum body sizes and are surveyed differently. Large bodied fish are highly mobile, generally have maximum sizes > 15cm and are counted by a trained diver in a 5m wide swathe along each transect. Small bodied fish are all site dependent damselfishes, mostly
Figure 2: - Sector-wide changes in coral cover and the numbers of A. solaris for survey reefs in the Capricorn-Bunker sector of the GBR. Orange trend line = Hard coral. Purple bars = Crown-of-thorns (COTS)
Image 1. A typical reef scene at Lady Musgrave Is. Reef showing high cover of corals, mostly plating and branching lifeforms from the genus Acropora
Image 2. An inquisitive teira batfish (Platax teira) approaches one of the survey team at Lady Musgrave Is. Reef.
Image 3. A team member descends at Wreck Island Reef. A 50 metre survey tape can be seen snaking over the abundant corals on the right-hand side of the image.
Video. This footage shows very high coral cover along with a tightly packed school of hussar (Lutjanus adetti) on one of the LTMP’s permanent monitoring sites at Wreck Island Reef, a total Preservation Zone. Survey reefs of varied zoning status in the Capricorn-Bunker Group all had high coral cover and diverse fish populations.


