-
Hard coral cover remained low (0-10%) in 2019,
-
Low cover was a result of declines to historical lows in 2017 due to coral bleaching
-
No coral feeding crown-of-thorns starfish Acanthaster solaris* were observed
Hard Coral Cover 0-10% 10-30% 30-50% 50-75% 75-100%
Figure 1: Map showing location of reefs in the Cairns sector.
Table 1: Overview of results obtained from manta tow surveys of reefs in the Cairns sector
| Cairns Sector | Summary | Trend since last survey |
|---|---|---|
| Median Coral Cover | Low (0-10%) | Stable |
| COTS status: | No Outbreaks | Stable |
| Coral bleaching: | Low | Stable |
As part of the Long-term Monitoring Program (LTMP), manta tow surveys of hard coral cover and the abundance of the coral feeding crown-of-thorns starfish (COTS), Acanthaster cf. solaris* were completed on fourteen reefs in the Cairns sector of the Great Barrier Reef (GBR). Preliminary results of the manta tow surveys are presented in Tables 1 and 2. The overall median hard coral cover remained low (0-10 %), as per the previous survey report in 2018 (Table 1). Hard coral cover declined on nine reefs and remained stable on five reefs. Declines were mainly due to coral bleaching events in the summers of 2016 and 2017. Outbreaks of COTS may also have contributed to declines (Table 2). However, because COTS control has been active the contribution of COTS to coral decline is difficult to measure accurately. No COTS were observed on manta tow surveys in 2019.
Scuba surveys at fixed sites (ten reefs) and broad-scale manta tow surveys recorded low levels (0-1%) of coral bleaching on all reefs. Coral diseases including white syndrome, black-band disease, brown-band disease and skeletal eroding band disease were rare at all reefs. The density of the corallivorous snail, Drupella spp., was moderate at Hastings reef (287 per hectare) and very low on the other reefs where scuba surveys were conducted.
Details of the manta tow method can be found in the Standard Operational Procedure No. 9 [AIMS Research - Crown-of-thorns Starfish and Coral Surveys - Standard Operational Procedure 9]. Further details of the monitoring program design, sampling methods and a full explanation of the A. solaris outbreak terminology can be found on the AIMS website.
*Note: genetic studies show that there are at least four species of COTS. These are the North and South Indian Ocean species (A. planci and A. mauritiensis), a Red Sea species (not yet named) and a Pacific species. The range of the Pacific includes the Great Barrier Reef and it has been provisionally named Acanthaster solaris (Haszprunar et. al. 2017).
Table 2: Summary of manta tow surveys of reefs in the Cairns sector. Arrows indicate the trend in live coral cover and A. solaris since last survey; ▲ = increase, ▼ = decrease, " " = no change. Outbreak Status: NO no outbreak, IO incipient outbreak >.22 COTS per tow, RE recovering, AO = Active Outbreak>1 COTS per tow.
| Reef | Shelf Position | Tows | Previous survey year | A. solaris | A. solaris per tow | Median Live Coral Cover | Median Soft Coral Cover | Reef Status |
|---|---|---|---|---|---|---|---|---|
| GREEN IS | Inner | 54 | 2017 | 0 | 0 | 0-5% ▼ | 0-5% ▼ | RE |
| LOW ISLETS | Inner | 31 | 2017 | 0 | 0 | 20-30% ▼ | 0-5% ▼ | NO |
| 16-017 | Mid | 15 | 2013 | 0 ▼ | 0 | 10-20% | 0-5% | RE |
| 16-024 | Mid | 37 | 2013 | 0 ▼ | 0 | 5-10% ▼ | 0-5% | NO |
| HASTINGS | Mid | 59 | 2018 | 0 | 0 | 0-5% ▼ | 0-5% ▼ | NO |
| MACKAY | Mid | 23 | 2017 | 0 | 0 | 5-10% ▼ | 5-10% ▲ | RE |
| MICHAELMAS | Mid | 106 | 2017 | 0 | 0 | 5-10% ▼ | 5-10% ▼ | NO |
| MIDDLE CAY (B) | Mid | 33 | 2013 | 0 ▼ | 0 | 0-5% ▼ | 0-5% ▼ | NO |
| PICKERSGILL | Mid | 76 | 2015 | 0 ▼ | 0 | 5-10% ▼ | 0-5% | RE |
| THETFORD | Mid | 43 | 2018 | 0 | 0 | 5-10% | 0-5% ▼ | NO |
| AGINCOURT NO.1 | Outer | 35 | 2018 | 0 | 0 | 10-20% | 0-5% | NO |
| ANDERSEN | Outer | 37 | 2007 | 0 | 0 | 20-30% | 0-5% | NO |
| OPAL (2) | Outer | 75 | 2017 | 0 | 0 | 0-5% ▼ | 0-5% ▼ | NO |
| ST. CRISPIN | Outer | 93 | 2018 | 0 | 0 | 0-5% | 0-5% | NO |
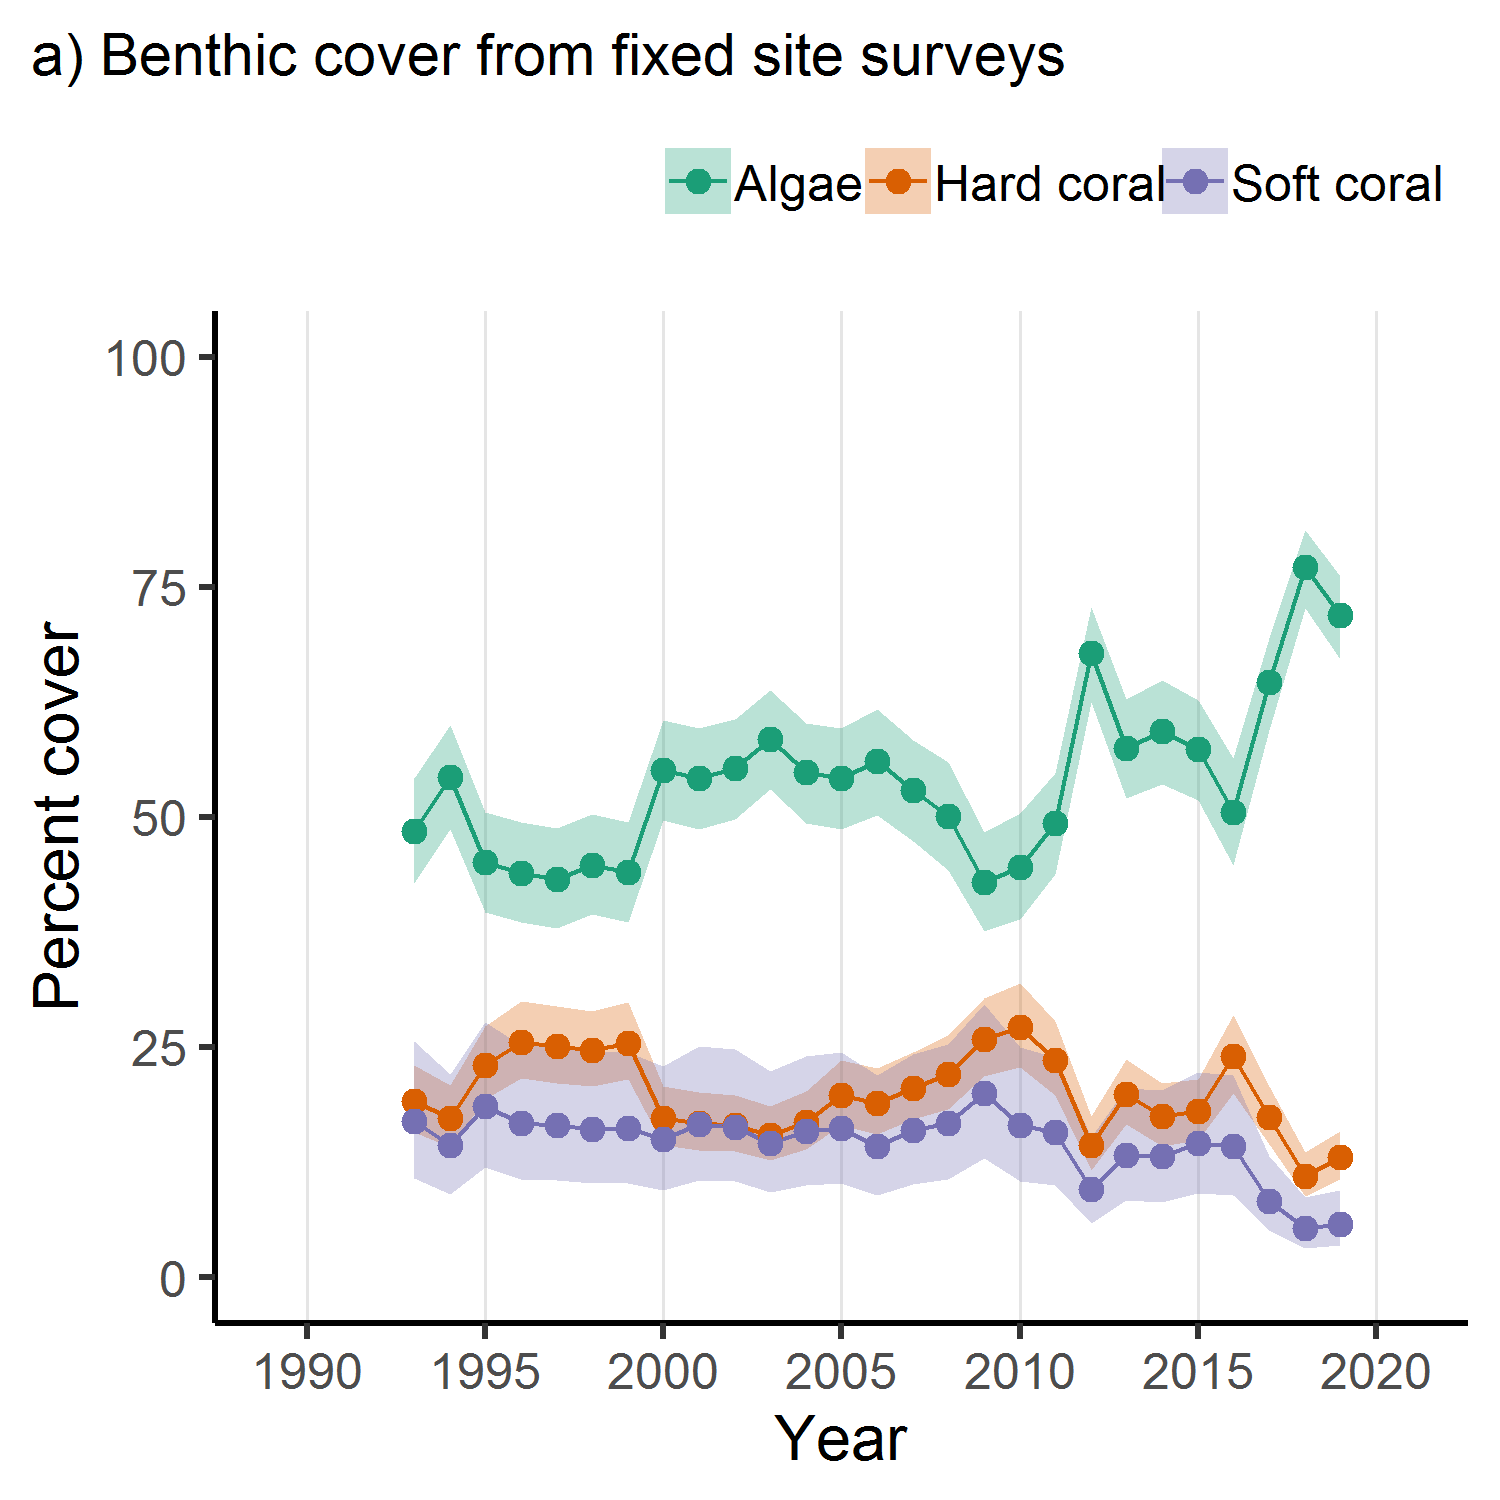
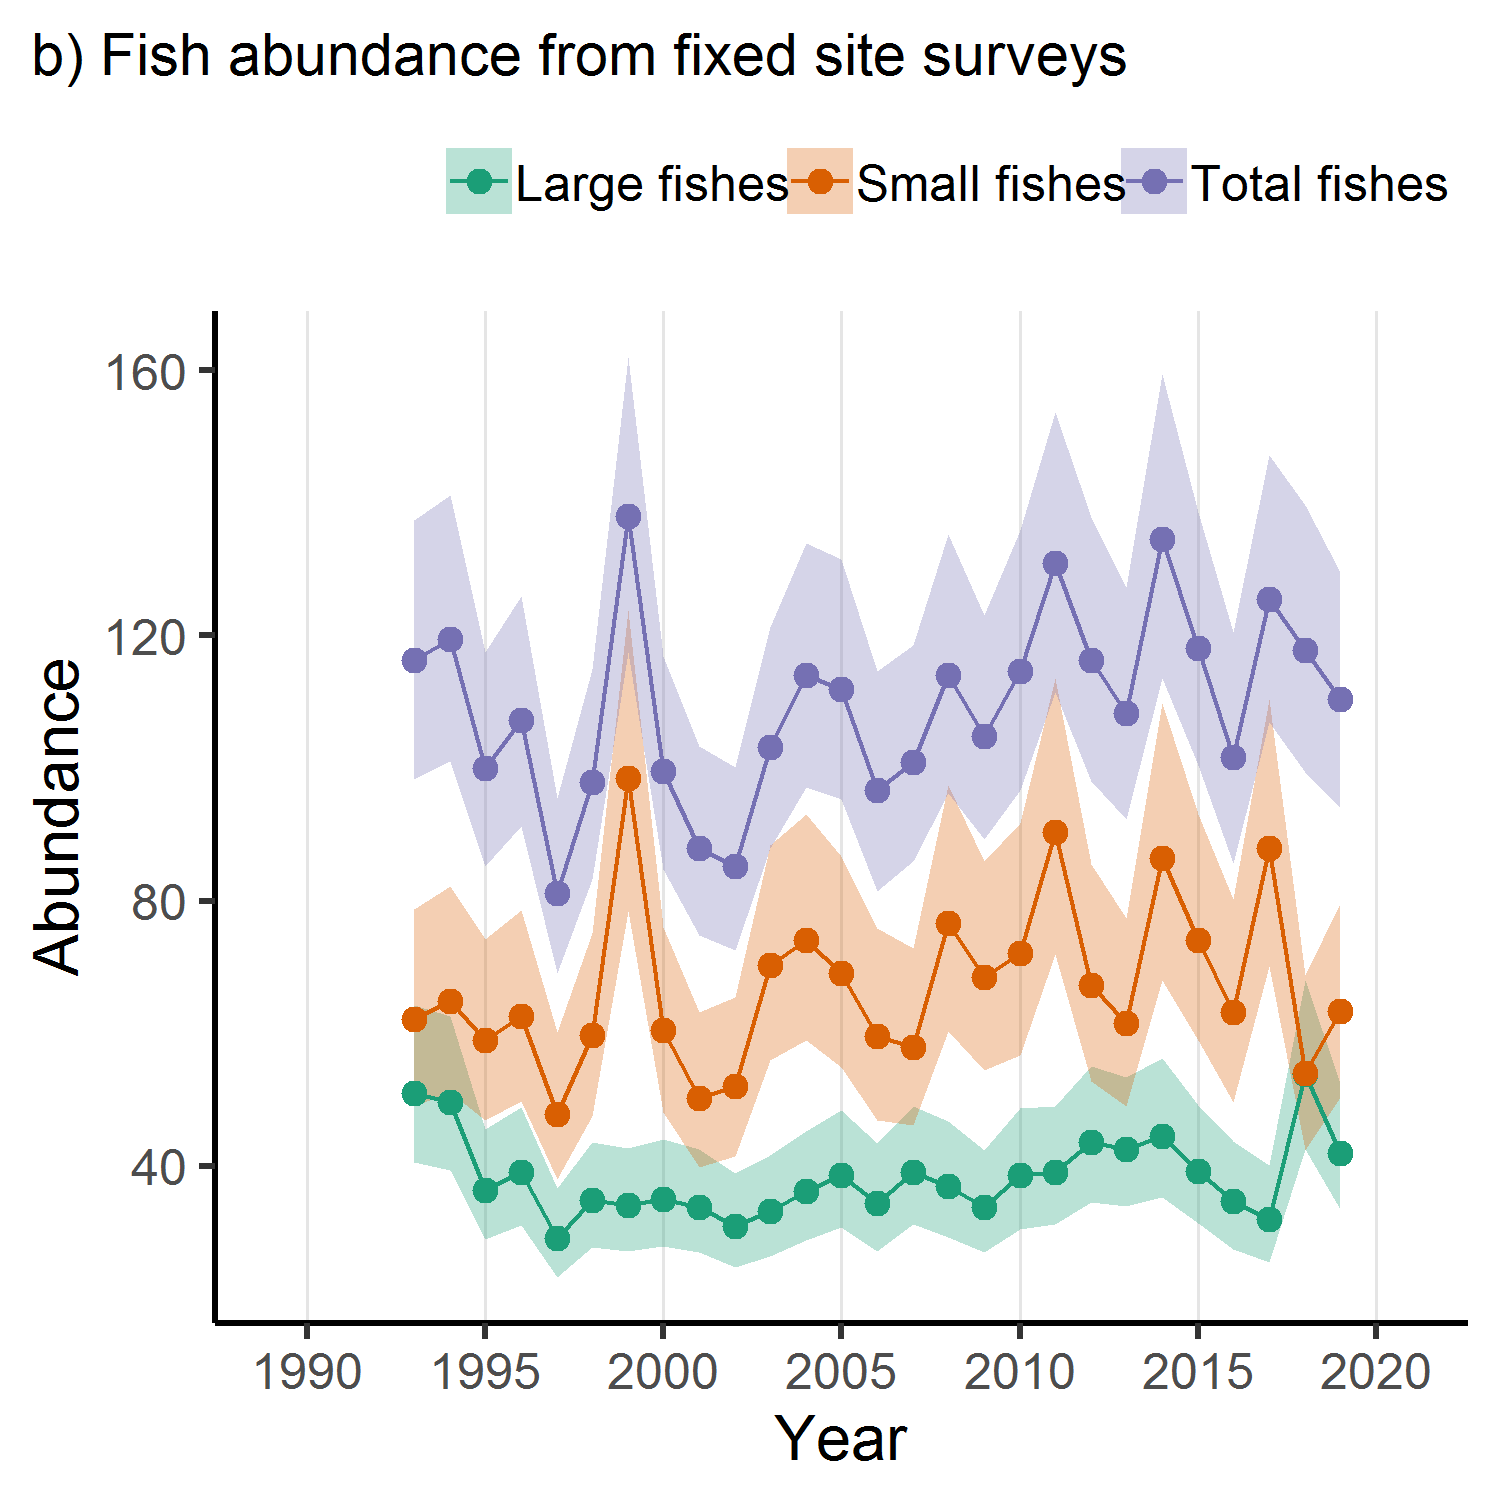
Figure 3: Estimates for benthic data and fish abundance from fixed site surveys. Data are mean estimates ± 95% credible intervals derived from Bayesian hierarchical linear models. Total fish abundance is the combined counts of two groups of fishes that have different maximum body sizes and are surveyed differently. Large bodied fish are highly mobile, generally have maximum sizes > 15cm and are counted by a trained diver in a 5m wide swathe along each transect. Small bodied fish are all site dependent damselfishes, mostly
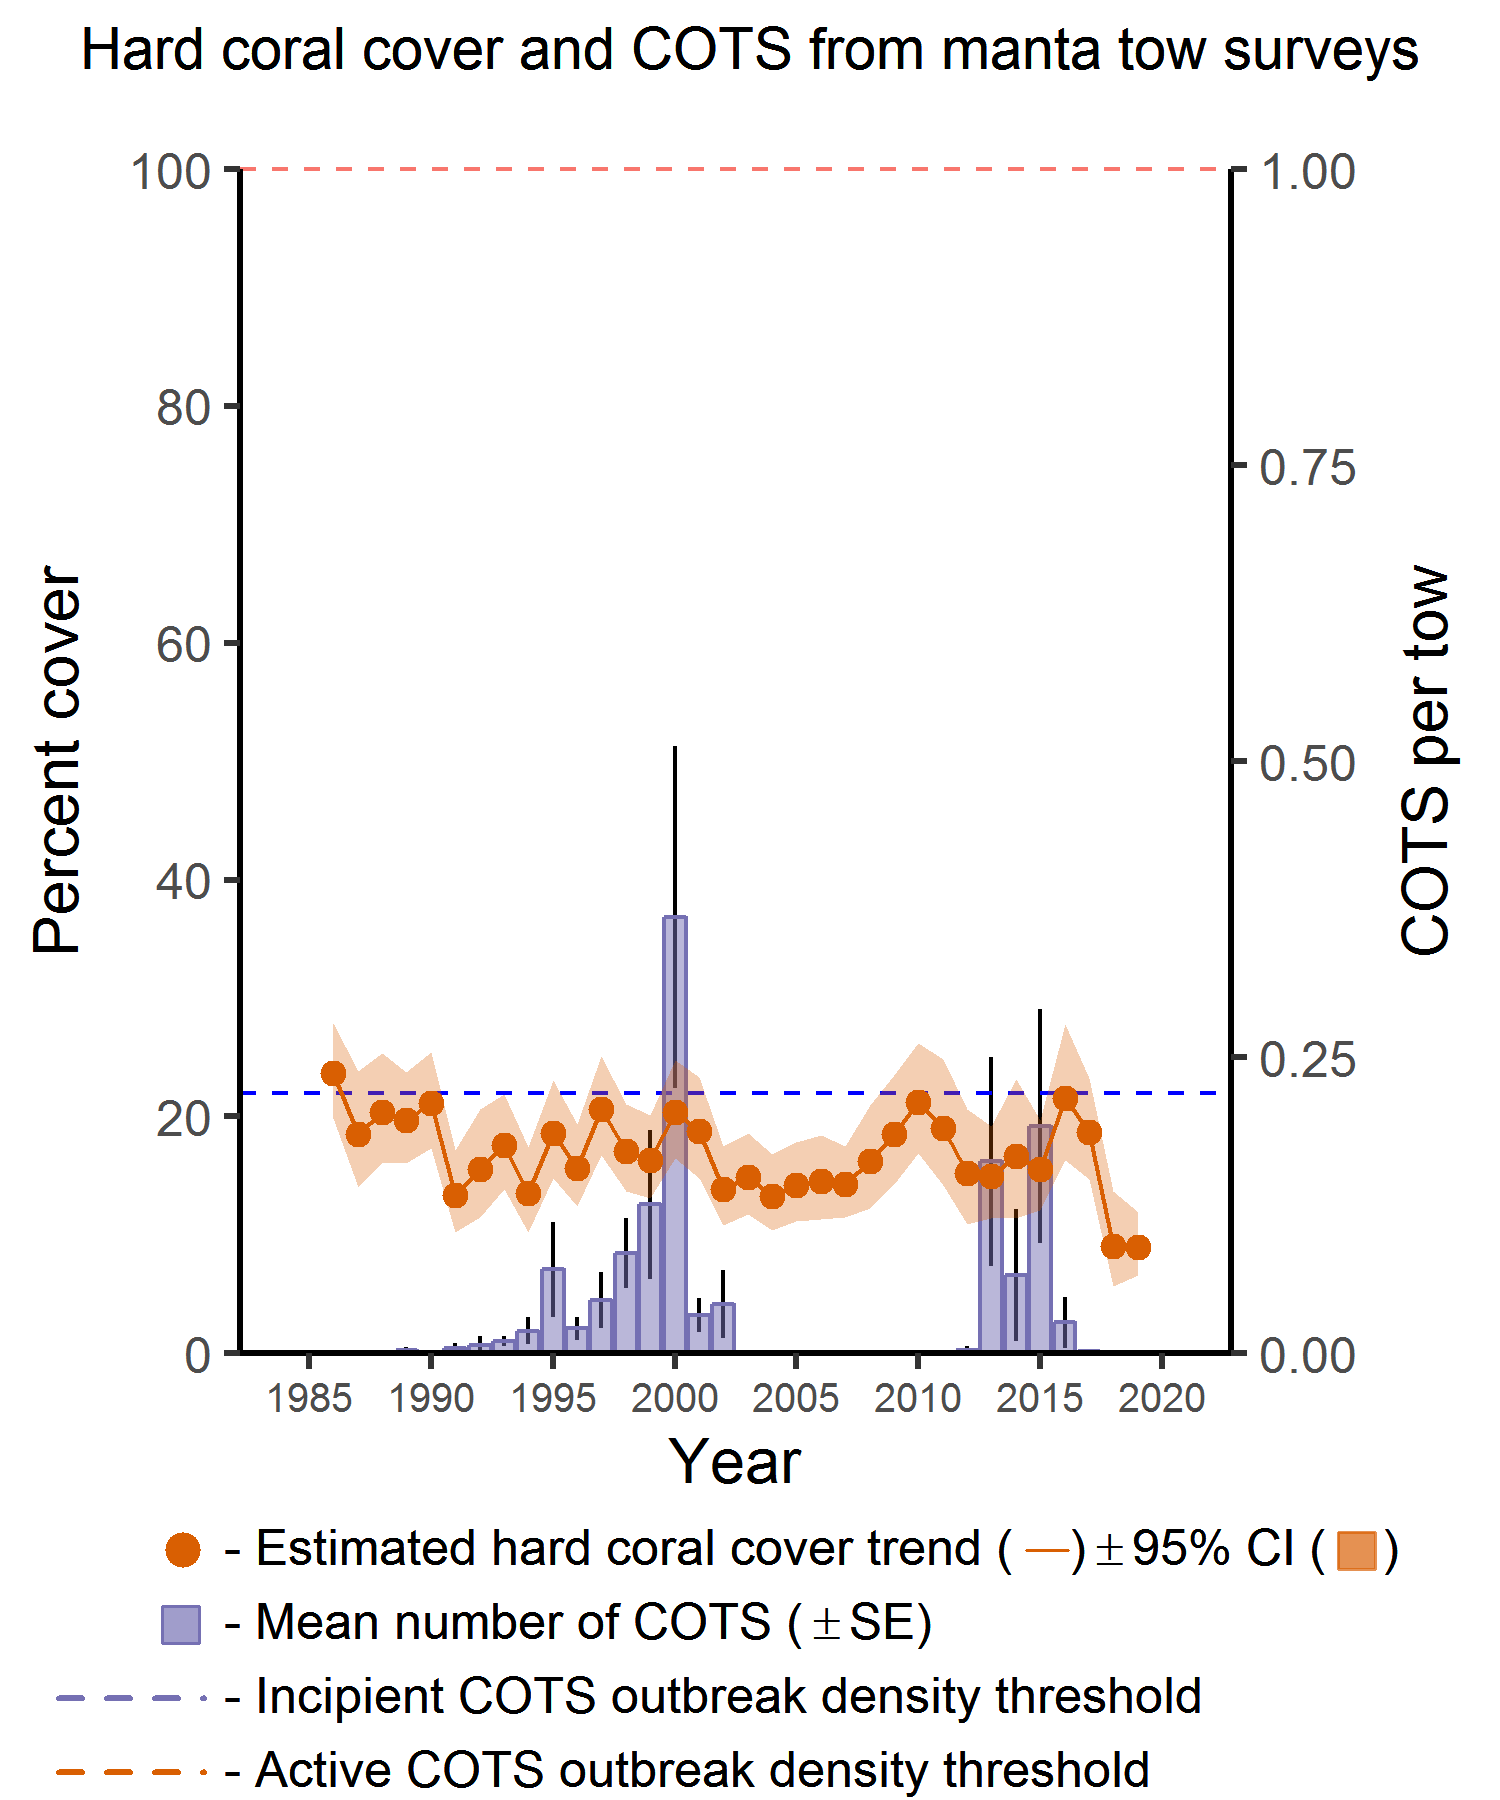
Figure 2: - Sector-wide changes in coral cover and the numbers of A. solaris for survey reefs in the Cairns sector of the GBR. Orange trend line = Hard coral. Purple bars = Crown-of-thorns (COTS)
Image 1. A sprawling stand of dead branching Acropora spp. on the reef slope. The branches are covered in a layer of turf algae. These corals most likely died as a result of bleaching in recent summers (2016 and 2017).
Image 2. Many young coral colonies, particularly digitate and tabulate growth forms of Acropora spp., scatter the turf-covered substrate of the reef slope at Andersen Reef. Among them are numerous dead coral colonies covered in a dark layer of turf. These corals probably died from bleaching in 2016 or 2017.
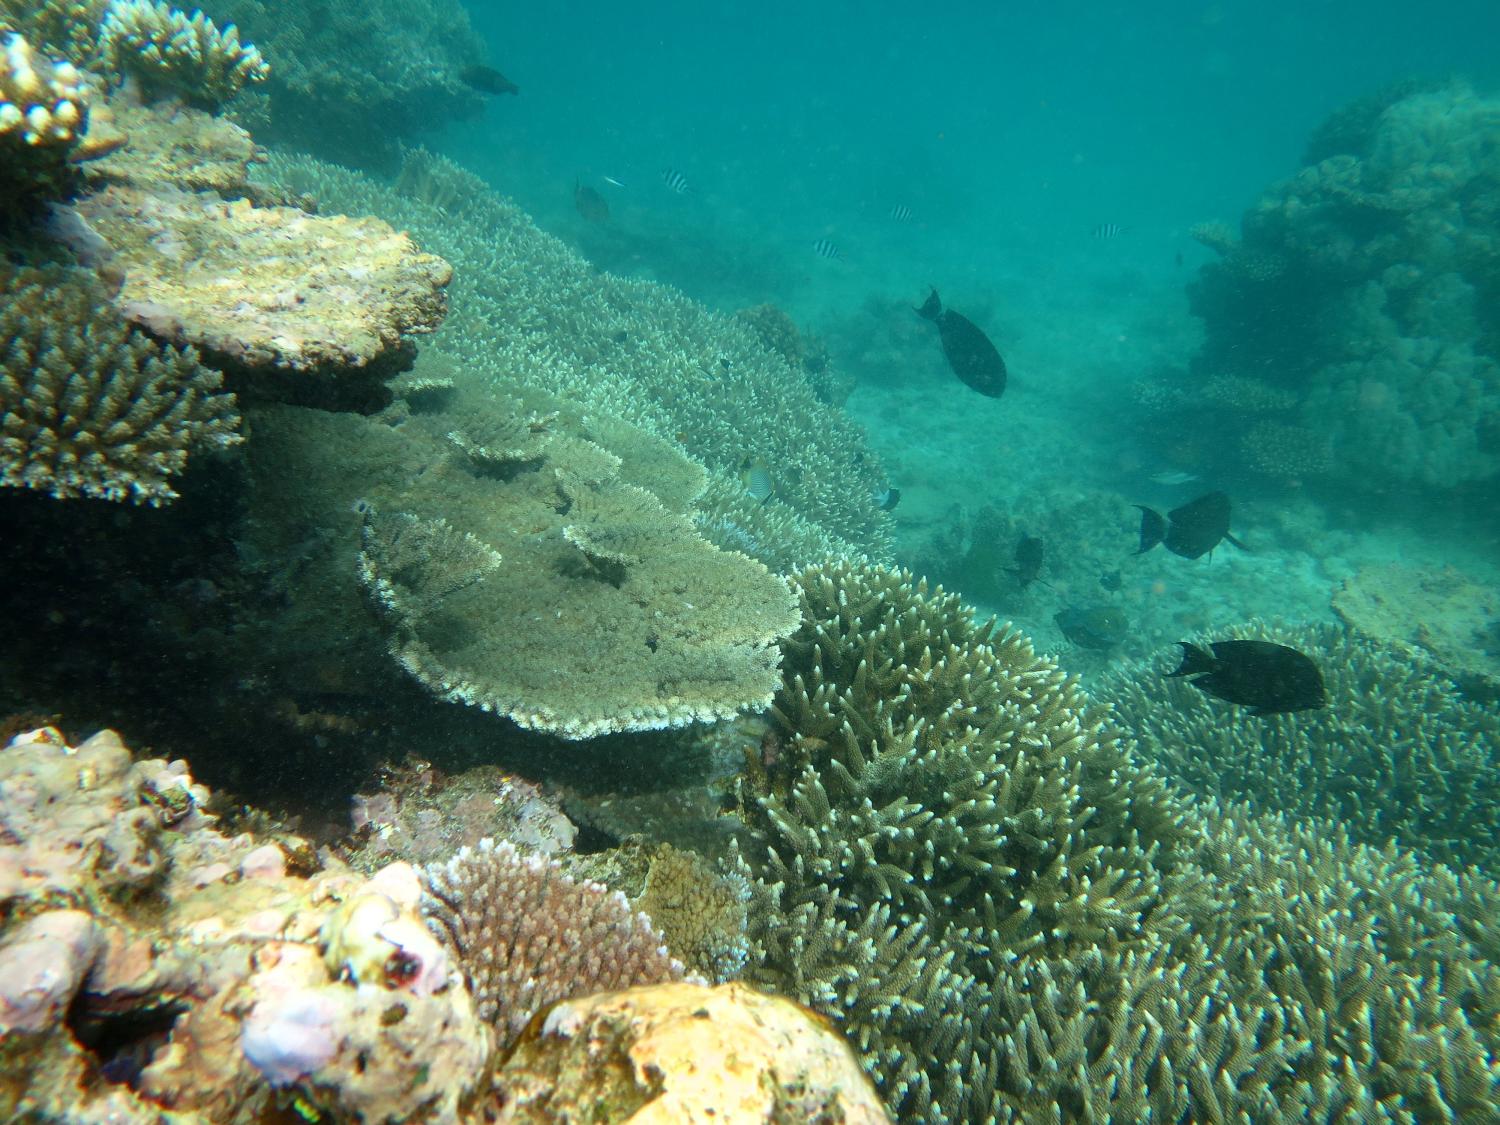
Image 3. A stretch of the reef slope at Hastings Reef where tabulate and branching growth forms of Acropora spp. are thriving.


