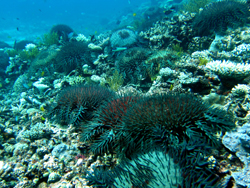
A crown-of-thorns (COTS) outbreak was recorded on Fairfax Reef in the Capricorn-Bunker sector of the Great Barrier Reef. This is the first time an active outbreak has been recorded from a reef in this region since the beginning of manta tow surveys in 1986.
Manta tow surveys are conducted by towing a snorkel diver behind a small boat holding on to a manta board. The boat stops every two minutes so the observer can record their observations. Whole reef perimeters can be sampled in a relatively short time using this method.
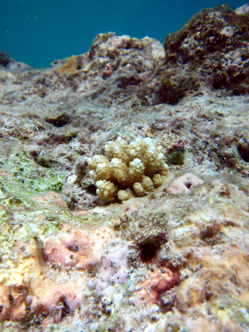
Reefs in this sector suffered large declines in coral cover due to the combined effects of storms in 2008 and cyclone Hamish in 2009. Surveys in 2012 revealed many small coral recruits such as this indicating the prognosis for reef recovery in the Capricorn-Bunker sector is good (with the exception of Fairfax for obvious reasons).
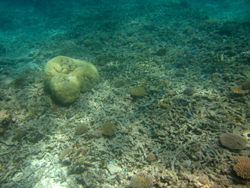
In this photo taken on Gannet Cay a number of new coral recruits can be seen growing on rubble. Signs of a recovery such as this are good for Gannet Cay reef that has suffered a long history of COTS outbreaks and the indignity of Cyclone Hamish that passed almost directly over this reef in March 2009.
Manta tow surveys discovered a COTS outbreak on Reef 21-060 in the Pompey sector. Most COTS outbreaks have been recorded from this region in the last decade. Only one outbreak was recorded prior to 2000 on Reef 21-155 in 1992. Up until recently Pompey sector reefs were notable for their generally high coral cover.
Manta tow surveys were completed on six reefs in the Capricorn-Bunker sector, seven reefs in the Swain sector and two in the Pompey sector of the Great Barrier Reef (GBR). Detailed surveys for benthic organisms, visual census of fishes and surveys for agents of coral mortality (SCUBA search) were made on all these reefs except for Gannet Cay in the Swain sector. Two further reefs in the Capricorn-Bunker sector were not manta towed. Preliminary results of the manta tow and SCUBA search surveys are presented in this report.
Median reef-wide live coral cover remained at similar levels to those recorded during previous surveys in 2008 when hard coral cover had declined on the majority of survey reefs in because of severe weather. The declines in hard coral cover in the Swain and Pompey sectors were attributed to Severe Tropical Cyclone Hamish in March 2009; declines in hard coral cover on Capricorn-Bunker reefs were due to the combined effects of a large storm in 2008 and Cyclone Hamish in 2009.
Manta tow surveys detected a crown-of-thorns starfish (COTS) outbreak on Fairfax reef in the Capricorn-Bunker sector. This is the first time that an active outbreak has been recorded from this sector since manta tow surveys began in 1986. There was another COTS outbreak on Reef 21-060 in the Pompey sector. Small numbers of COTS, well below outbreak densities, were also recorded during manta tow surveys on Reef 21-245 in the Swain sector. Manta tow survey results are summarised in Tables 1, 3 and 5.
Small numbers of COTS, below outbreak levels, were recorded during scuba search surveys on Reef 21-060 and Pompey #1 Reef in the Pompey sector and on Fairfax Island Reef in the Capricorn-Bunker sector. No COTS were recorded during scuba surveys on any reef in the Swain sector. On all reefs surveyed signs of coral disease, counts of Drupella spp. and coral bleaching were generally below those seen in previous surveys. The one exception being Reef 21-245 in the Swain sector where counts of Drupella spp. were ten times those seen previously on this reef but still not exceptional when compared with numbers on other reefs in this sector. The SCUBA search results are summarised in Tables 2, 4 and 6.
Details of the manta tow method can be found in the Standard Operational Procedure No. 9 [AIMS Research - Crown-of-thorns Starfish and Coral Surveys - Standard Operational Procedure 9]. For a full explanation of the COTS outbreak terminology used in this report refer to the following web-page: Crown-of-thorns on the Great Barrier Reef.
Perimeters of six reefs were surveyed using manta tow (Table 1). Three sites on each of these reefs and a further two reefs were then surveyed in detail using scuba (Table 2). During manta tows surveys 32 COTS were observed on Fairfax Reef. This population was highly concentrated on the back reef area and constituted an Active Outbreak. This is the first time an Active Outbreak has been recorded using manta tow on any reef in this sector since the beginning of surveys in 1986. No COTS were observed during manta tows on any of the other survey reefs in the sector.
Since the last surveys in 2010, median reef-wide live coral cover on these reefs has either marginally increased (Boult, Erskine), or remained stable (Masthead Island, Hoskyn, Fairfax, Lady Musgrave) (Table 1). The relatively low coral cover on these reefs was due to a combination of large storms in 2008, which dramatically reduced cover on the majority of reefs in this sector, and Cyclone Hamish in 2009, which passed some 100km to the east of the Capricorn-Bunker reef complex and further reduced cover. Despite these setbacks, many small coral recruits were observed so the prognosis for recovery on these reefs is good. No bleaching of hard corals was recorded during manta tow surveys of reefs in this sector in 2012.
Scuba searches on the intensive survey sites found white syndrome disease on all reefs in this sector except for Broomfield. However, the numbers of affected colonies were lower than in previous surveys (2010). Brown band disease affected low to moderate numbers of colonies on most reefs, whilst skeletal eroding band disease was seen on low numbers of colonies on the majority of reefs. One COTS was observed on Fairfax Island reef suggesting that COTS are not strictly localized to the back reef area on this reef. Counts of Drupella spp. were generally below those recorded in 2010.
Table 1.Summary of manta tow survey results for the Capricorn-Bunker sector.
|
Reef |
Shelf Position |
Tows |
COTS |
COTS per tow |
Median % Live Coral Cover |
Median % Dead Coral Cover |
Median % Soft Coral Cover |
Reef Status |
|
Outer |
20 |
0 |
0 |
20 to 30 |
0 to 0 |
0 to 5 |
NO |
|
|
Outer |
49 |
0 |
0 |
10 to 20 |
0 to 0 |
0 to 5 |
NO |
|
|
Outer |
38 |
0 |
0 |
10 to 20 |
0 to 0 |
0 to 5 |
NO |
|
|
Outer |
29 |
0 |
0 |
10 to 20 |
0 to 0 |
0 to 5 |
NO |
|
|
Outer |
33 |
32 |
0.97 |
5 to 10 |
0 to 0 |
0 to 5 |
AO |
|
|
Outer |
49 |
0 |
0 |
5 to 10 |
0 to 0 |
0 to 5 |
NO |
|
|
Overall GBR average for last survey - visit 2010 |
All |
|
|
0.02 |
10 to 20 |
0 to 5 |
0 to 5 |
- |
|
Long-term average value |
Mid |
|
|
0 |
30 to 40 |
0 to 5 |
0 |
- |
|
Long-term average value |
Outer |
|
|
0.01 |
30 to 40 |
0 to 5 |
0 to 5 |
- |
|
Average last survey - visit 2010 |
Outer |
|
|
0.02 |
10 to 20 |
0 to 5 |
0 to 5 |
- |
Table 2.Summary of SCUBA search survey results for the Capricorn-Bunker sector.
|
Reef |
Shelf |
COTS <5cm |
COTS >5 cm |
COTS >15cm |
COTS >25cm |
WS |
BBD |
BrB |
SEB |
Drupella |
|
O |
0 |
0 |
0 |
0 |
4 |
2 |
3 |
0 |
0 |
|
|
O |
0 |
0 |
0 |
0 |
0 |
3 |
1 |
0 |
1 |
|
|
O |
0 |
0 |
0 |
0 |
18 |
1 |
9 |
9 |
1 |
|
|
O |
0 |
0 |
0 |
0 |
3 |
1 |
0 |
4 |
7 |
|
|
O |
0 |
0 |
0 |
0 |
2 |
0 |
2 |
1 |
19 |
|
|
O |
0 |
0 |
0 |
0 |
17 |
0 |
11 |
1 |
15 |
|
|
O |
0 |
0 |
0 |
1 |
2 |
0 |
5 |
3 |
31 |
|
|
O |
0 |
0 |
0 |
0 |
2 |
0 |
0 |
0 |
3 |
|
|
Overall GBR average for last survey - 2010 |
All |
0 |
0.054 |
0.036 |
0.52 |
9.9 |
0.054 |
3.4 |
3.7 |
17 |
|
Long term average value |
O |
0 |
0.035 |
0.13 |
0.092 |
35 |
0.13 |
4.2 |
1.8 |
8 |
|
Average last survey - 2010 |
O |
0 |
0.13 |
0.13 |
0.13 |
14 |
0 |
6.5 |
0.63 |
19 |
O=outer, WS = White Syndrome, BBD = Black Band Disease, BrB = Brown Band Disease, SEB = Skeletal Eroding Band Disease.
For more information on white syndrome refer to the AIMS web site at:
AIMS Long Term Monitoring - Coral Diseases on the Great Barrier Reef - Introduction
Perimeters of seven reefs were surveyed using manta tow (Table 3). Three sites on each of these reefs, except for Gannet Cay, were then surveyed in detail using scuba (Table 4).One COTS was recorded at Reef 21-245 in the Swains during manta tow surveys, but none were recorded during the intensive scuba search surveys on any reefs in this sector. This provides further evidence that the COTS outbreaks that occurred during the early part of the decade have run their course.
In general patterns of change in coral cover on reefs in this region strongly reflect recent declines attributable to the effects of Cyclone Hamish that passed through the area in March 2009. For example, median reef-wide live coral cover on Reef 21-558 declined sharply from 20-30% in 2008 before Hamish to 5-10% recorded during current surveys. However there were a number of anomalies. Coral cover appears to have declined on a further two reefs post cyclone Hamish (Reef 21-278 from 10-30% to 5-10% and Reef 21-302 from 40-50% to 10-20%). While the relatively small decline on Reef 21-278 may be attributable to post cyclone mortality the large decline observed on Reef 21-302, in the absence of any major disturbance, is more difficult to explain and remains enigmatic. No change in reef-wide live coral cover was observed on Gannet Cay and Reef 21-296 since last surveyed in 2011 and 2010 respectively. Two reefs showed a small increase in reef-wide live coral cover since last surveyed in 2010 (Reef 21-245 from 0-5% to 5-10% and East Cay from 5-10% to 10-20%). No bleaching of hard corals was recorded during manta tow surveys of reefs in this sector in 2012.
Scuba searches on the intensive survey sites found white syndrome disease on the majority reefs in this sector. Compared to previous surveys in 2010, the number of infected colonies had decreased on all reefs. Low levels of brown band disease were recorded at only two reefs (21-296 and East Cay), whilst skeletal eroding band disease occurred in very low numbers on three reefs (21-245, 21-296 and 21-245). Drupella spp. numbers were lower than in previous surveys. An exception was Reef 21-245 where there were many more Drupella than in 2010, though the current abundance was still not exceptionally high.
Table 3.Summary of manta tow survey results for the Swain sector.
|
Reef |
Shelf Position |
Tows |
COTS |
COTS per tow |
Median % Live Coral Cover |
Median % Dead Coral Cover |
Median % Soft Coral Cover |
Reef Status |
|
Mid |
59 |
1 |
0.02 |
5 to 10 |
0 to 0 |
0 to 5 |
NO |
|
|
Mid |
23 |
0 |
0 |
5 to 10 |
0 to 0 |
0 to 5 |
NO |
|
|
Mid |
21 |
0 |
0 |
0 to 5 |
0 to 0 |
0 to 5 |
RE |
|
|
Outer |
47 |
0 |
0 |
10 to 20 |
0 to 0 |
0 to 5 |
NO |
|
|
Outer |
26 |
0 |
0 |
10 to 20 |
0 to 5 |
0 to 5 |
NO |
|
|
Outer |
63 |
0 |
0 |
10 to 20 |
0 to 5 |
0 to 5 |
NO |
|
|
Outer |
47 |
0 |
0 |
5 to 10 |
0 to 0 |
0 to 5 |
NO |
|
|
Overall GBR average for last survey - 2010 |
All |
|
|
0.02 |
10 to 20 |
0 to 5 |
0 to 5 |
- |
|
Long term average value |
Inner |
|
|
0 |
30 to 40 |
0 to 5 |
0 |
- |
|
Long term average value |
Mid |
|
|
1.39 |
10 to 20 |
0 to 5 |
0 to 5 |
- |
|
Long term average value |
Outer |
|
|
1.15 |
20 to 30 |
0 to 5 |
0 to 5 |
- |
|
Average last survey - 2010 |
Mid |
|
|
0 |
0 to 5 |
0 |
0 to 5 |
- |
Table 4.Summary of SCUBA search survey results for the Swain sector.
|
Reef |
Shelf |
COTS <5cm |
COTS >5 cm |
COTS >15cm |
COTS >25cm |
WS |
BBD |
BrB |
SEB |
Drupella |
|
M |
0 |
0 |
0 |
0 |
3 |
0 |
0 |
1 |
35 |
|
|
M |
0 |
0 |
0 |
0 |
3 |
0 |
0 |
0 |
26 |
|
|
O |
0 |
0 |
0 |
0 |
8 |
0 |
3 |
1 |
8 |
|
|
O |
0 |
0 |
0 |
0 |
0 |
0 |
0 |
0 |
14 |
|
|
O |
0 |
0 |
0 |
0 |
0 |
0 |
1 |
0 |
14 |
|
|
O |
0 |
0 |
0 |
0 |
1 |
0 |
0 |
0 |
0 |
|
|
Overall GBR average for last survey - 2008 |
All |
0 |
0.054 |
0.036 |
0.52 |
9.9 |
0.05 |
3.4 |
3.7 |
17 |
|
Long term average value |
Mid |
0.019 |
0.44 |
3.2 |
0 |
11 |
0.16 |
1.3 |
2.4 |
23 |
|
Long term average value |
Outer |
0 |
0.1 |
2.9 |
0 |
2.6 |
0.08 |
0.35 |
0.82 |
4.4 |
|
Average last survey - 2008 |
Mid |
0 |
0 |
0 |
0 |
18 |
0 |
3.6 |
3.9 |
20 |
M=mid, O=outer, WS = White Syndrome, BBD = Black Band Disease, BrB = Brown Band Disease, SEB = Skeletal Eroding Band Disease.
Perimeters of two Pompey sector reefs were surveyed using manta tow (Table 5). Three sites on each of these reefs were then surveyed in detail using scuba (Table 6). Twenty-seven COTS were recorded at Reef 21-060 during manta tow surveys (and five were recorded at this reef during the detailed SCUBA search surveys). COTS numbers have been increasing since this reef was first surveyed in 2006; it was classified as an Incipient Outbreak in 2010. This reef has now been reclassified as having an Active Outbreak. No COTS were recorded at Pompey Reef #1 during manta tow surveys.
Median reef-wide live coral cover remained low on Reef 21-060 and is unlikely to recover while COTS remain active. In contrast some recovery was seen on Pompey Reef #1 that had a moderate (10-20%) coral cover compared to a low (5-10%) cover when last surveyed in 2010. Coral cover on both reefs was significantly reduced by the impact of Cyclone Hamish in March 2009. No bleaching of hard corals was recorded during manta tow surveys of reefs in this sector in 2012.
Scuba searches on the intensive survey sites at both reefs in this sector showed that where disease was encountered it was recorded at lower levels than those observed in previous years. Similarly Drupella spp. counts at both reefs were lower than those observed when they were last surveyed in 2010. Small numbers of COTS were also observed on the fixed sites at both reefs. The COTS on Reef 21-060 were conspicuous for their large size and were in numbers just too low to constitute a localized Active Outbreak.
Table 5.Summary of manta tow survey results for the Pompey sector.
|
Reef |
Shelf Position |
Tows |
COTS |
COTS per tow |
Median % Live Coral Cover |
Median % Dead Coral Cover |
Median % Soft Coral Cover |
Reef Status |
|
Mid |
44 |
0 |
0 |
10 to 20 |
0 to 5 |
0 to 5 |
NO |
|
|
Mid |
22 |
27 |
1.23 |
5 to 10 |
0 to 5 |
0 to 5 |
AO |
|
|
Overall GBR average for last survey - 2010 |
All |
|
|
0.02 |
10 to 20 |
0 to 5 |
0 to 5 |
- |
|
Long term average value |
Mid |
|
|
0.28 |
30 to 40 |
0 to 5 |
0 to 5 |
- |
|
Average last survey - 2010 |
Mid |
|
|
0.16 |
5 to 10 |
0 to 5 |
0 to 5 |
- |
Table 6.Summary of SCUBA search survey results for the Pompey sector.
|
Reef |
Shelf |
COTS <5cm |
COTS >5 cm |
COTS >15cm |
COTS >25cm |
WS |
BBD |
BrB |
SEB |
Drupella |
|
M |
0 |
1 |
0 |
0 |
21 |
0 |
4 |
7 |
25 |
|
|
M |
0 |
0 |
0 |
5 |
1 |
0 |
1 |
0 |
7 |
|
|
Overall GBR average for last survey - 2010 |
All |
0 |
0.054 |
0.036 |
0.52 |
9.9 |
0.05 |
3.4 |
3.7 |
17 |
|
Long term average value |
M |
0.094 |
0.31 |
0.63 |
2.1 |
13 |
0.22 |
5.7 |
3.9 |
18 |
|
Average last survey - 2010 |
M |
0 |
0.2 |
0.1 |
2.7 |
11 |
0.2 |
5.5 |
2.3 |
23 |
M=mid, WS = White Syndrome, BBD = Black Band Disease, BrB = Brown Band Disease, SEB = Skeletal Eroding Band Disease.
References
English, S., Wilkinson, C. and Baker, V. (1997) Survey Manual for Tropical Marine Resources (2ndEdition). Australian Institute of Marine Science. Townsville.
This project is partially supported by the Marine and Tropical Sciences Research Facility
For further information contact
Dr. Hugh Sweatman , AIMS
Telephone: +61 7 4753 4470
Fax: +61 7 4753 4288
Email: h.sweatman@aims.gov.au


