Report onsurveys of reefs in the Capricorn Bunker, Swain and Pompey sectors of the Great Barrier Reef.
Dates: 25th November - 15th December 2010
Vessel: MV Centurion
Survey leader:
![]()
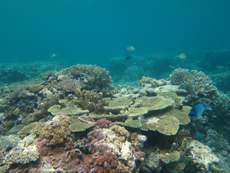
Image 1.Some parts of Broomfield Reef have escaped the ravages of storms and cyclones, and have retained a good diversity of hard corals.
Photo: AIMS LTMP.
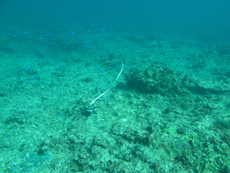
Image 2. Those parts of Broomfield Reef directly exposed to prevailing wind and waves have had most hard corals removed by storms and cyclones. Here on one of the exposed scuba survey sites a transect line snakes across a relatively featureless reefscape. Note the swarms of Neon Damselfish (Pomacentrus coelestis), one of the few fish species to increase in abundance after such habitat destruction on the southern GBR.
Photo: AIMS LTMP.
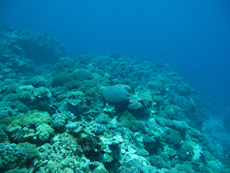
Image 3: Of all the reefs surveyed during this cruise, Chinaman Reef in the Swain sector had the highest median coral cover and appeared to be recovering well from past outbreaks of crown-of-thorns-starfish. Hard and soft corals are both abundant on this reef.
Photo: AIMS LTMP.
Image 4:During SCUBA surveys at Chinaman Reef a number of Pygmy Devil Rays (Mobula eregoodootenkee) wheeled around in deeper waters off the reef slope. These animals, with a disc width of a little over 1m, are smaller relatives of the better known manta ray (Manta birostris) which can grow to a disc width of 6.7m and weights of over 2 tonnes.
Photo: AIMS LTMP.
Image 5:Reef 21-529 in the Swain sector appears to have suffered the full force of Cyclone Hamish in 2009. This reef has had total preservation status (no entry by any vessels or humans unless under permit) for many years and prior to 2009 supported luxuriant coral cover, typified by fields of branching Acropora corals. A wide diversity of associated fauna had also enhanced the visual appeal of this reef. Unfortunately this photo of piled up coral rubble typifies the result of the severe sea conditions that Cyclone Hamish generated. Much of the reef slope is now a mass of rubble occasionally punctuated by large sections of reef crest that had sheared off and were rolled into deeper waters.
Photo: AIMS LTMP.
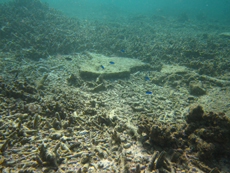
Image 6:Cyclone Hamish also caused considerable damage further north in the Pompey sector of the GBR. Here smashed coral skeletons lie on the seabed at Reef 20-354.
Photo: AIMS LTMP.
Summary
Three reefs in the Capricorn Bunker sector, seven reefs in the Swain sector and two reefs in the Pompey sector were surveyed for crown-of-thorns starfish and coral cover using manta tows. Intensive scuba surveys for benthic organisms, reef fishes and agents of coral mortality (scuba searches) were completed on fixed sites on all these reefs, as well as on a fourth reef in the Capricorn Bunker sector which could not be manta towed due to bad weather. Preliminary results of the manta tow surveys and scuba searches are presented in this report.
No active outbreaks of crown-of-thorns starfish (COTS) were found. COTS were recorded in very low numbers during manta tows; a single COTS was recorded on a reef in the Swain sector and on each of two reefs in the Pompey sector. No COTS were observed during scuba searches. The last major COTS outbreaks on the southern GBR began in the Swain sector during the 1990's. Of the seven key survey reefs in this sector, four have being affected since that time, with one, Gannet Cay, sustaining an Active Outbreak for over a decade. No Active Outbreaks have been recorded from this sector since 2006 and those four reefs are still designated as Recovering from previous outbreaks.
In recent years reef-wide median live coral cover has dropped dramatically on all key survey reefs in the Capricorn Bunker sector. This is likely due to the combined effects of storm damage recorded in 2008 and cyclone Hamish. This severe category 4 tropical rotating storm passed some 100km to the east of reefs in this region in March 2009, generating strong winds and big seas. Hard coral cover is now low (5-10%) to moderate (10-20%) on the three reefs in this sector that were surveyed by manta tow, whereas cover was moderate (20-30%) to high (30-50%) on these reefs prior to 2008.
Cyclone Hamish had similar if not greater impacts on reefs in the Swain sector. In the most extreme case, median reef-wide live coral cover on Reef 21-529 was reduced from a very high (50-60%) to very low (0-5%) level. Recent surveys show that coral cover at five of the seven reefs has been stable at low levels (1-10%) since cyclone Hamish. The decline in coral cover at Snake Reef in the Swain sector was also likely due to the effects of cyclone Hamish even though this was the first time that this reef had been surveyed since 2008. However, coral cover on the other reef (East Cay) dropped from high (30-40%) to low (5-10%) some time after cyclone Hamish; the reason(s) for this change are unknown. Six of the seven Swain survey reefs had low or very low coral cover. Hard coral cover declined since 2009 on the two survey reefs in the Pompey sector. This was almost certainly due to cyclone Hamish given their proximity to the destructive eye and the large quantity of broken coral skeletons observed during surveys.
Scuba searches found few incidences of coral diseases and numbers of coral feeding gastropods (Drupella spp.) were comparable to those seen in previous years in both the Capricorn Bunker and Swain sectors. This is not surprising given the low cover of live corals on survey sites in these sectors.
A summary of the results is presented in Tables 1 to 5. A full list of survey reefs appears in the Long-term Monitoring Status Report Number 8. Details of the monitoring program design, the sampling methods and a full explanation of the COTS outbreak terminology used in this report can be found on the AIMS reef monitoring website.
Capricorn Bunker Sector
Four key reefs were surveyed intensively using scuba (Table 2) and three of these were also surveyed by manta tow (Table 1). Sea conditions were too rough to safely conduct manta tows around Lady Musgrave Island. No COTS were observed during manta tow surveys or scuba searches (Table 1, 2) though one COTS was observed on a patch reef in the lagoon at Lady Musgrave Island. This is not unusual; COTS have been encountered on rare occasions during a long history of surveys in this sector.
Median reef-wide live coral cover (hereafter coral cover) on the three reefs that were surveyed by manta tow varied from low (5-10%) to moderate (10-20%, Table 1). Although manta tows of Lady Musgrave Island were missed, the most recent manta tow surveys in January 2010 revealed that coral cover at this reef was low (5-10%). The current levels of coral cover at the four survey reefs represent considerable declines from the moderate (20-30%) to high (30-50%) levels recorded prior to 2008. These declines in coral cover were due to a combination of large storms in 2008 and cyclone Hamish in March 2009 that further reduced coral cover to the present level. On fixed sites, tabulate and branching Acropora spp. corals that previously dominated the benthos had largely been removed by wave action leaving vast expanses of featureless, flat pavement. Numbers and diversity of fishes had also declined. Similar changes were recorded following major storms in the late 1980's. Following those events the coral and fish communities took a little over a decade to recover.
Table 1.Summary of manta tow survey results for the Capricorn Bunker sector
| ã |
Shelf Position |
Tows |
COTS |
COTS per tow |
Median % Live Coral Cover |
Median % Dead Coral Cover |
Median % Soft Coral Cover |
Reef Status |
|
Outer |
48 |
0 |
0 |
10 to 20 |
0 to 5 |
0 to 5 |
NO |
|
|
Outer |
45 |
0 |
0 |
10 to 20 |
0 to 0 |
0 to 5 |
NO |
|
|
Outer |
67 |
0 |
0 |
5 to 10 |
0 to 0 |
0 to 5 |
NO |
|
|
Overall GBR average for last survey (2008) |
All |
ã | ã |
0.01 |
10 to 20 |
0 to 5 |
0 to 5 |
- |
|
Long-term average value |
Mid |
ã | ã |
0 |
30 to 40 |
0 to 5 |
0 |
- |
|
Long-term average value |
Outer |
ã | ã |
0 |
30 to 40 |
0 to 5 |
0 to 5 |
- |
|
Average last survey (2008) |
Outer |
ã | ã |
0 |
20 to 30 |
0 to 5 |
0 to 5 |
- |
Scuba searches on the intensive survey sites (Table 2) showed few incidences of disease and numbers of the corallivorous snail, Drupella spp., were low compared to previous records. The low values recorded were a reflection of the scarcity of live corals on the scuba survey sites. These sites had particularly low coral cover because they were exposed to the full force of storm and cyclone induced waves. Coral cover recorded during manta tows was higher because these surveys included some areas of reefs that were protected from the worst of the swells and so retained some live corals.
Table 2.Summary of results of scuba searches on reefs in the Capricorn Bunker sector
|
Reef |
Shelf Position |
COTS (<5cm) |
COTS (>5cm) |
COTS (>15cm) |
COTS (>25cm) |
WS |
BBD |
BrB |
SEB |
Drupella |
|
O |
0 |
0 |
0 |
0 |
5 |
0 |
1 |
0 |
4 |
|
|
O |
0 |
0 |
0 |
0 |
0 |
0 |
0 |
0 |
3 |
|
|
O |
0 |
0 |
0 |
0 |
0 |
0 |
2 |
0 |
3 |
|
|
O |
0 |
0 |
0 |
0 |
0 |
0 |
1 |
0 |
0 |
|
|
Overall GBR Average last survey (2008) |
All |
0 |
0.021 |
0.11 |
0.043 |
14 |
0.19 |
4.9 |
4.8 |
15 |
|
Long term average |
O |
0 |
0.038 |
0.14 |
0.086 |
38 |
0.032 |
4.3 |
1.8 |
7.9 |
|
Average last survey (2008) |
O |
0 |
0.25 |
0.75 |
0 |
35 |
0.25 |
11 |
6 |
9.8 |
WS = White Syndrome, BBD = Black Band Disease, BrB = Brown Band Disease, SEB = Skeletal Eroding Band Disease.
Swain Sector
Broadscale surveys using manta tow and intensive scuba searches for signs of coral mortality were made on seven core reefs in the Swain sector (Tables 3 and 4). Only one COTS was observed during manta tow surveys (Table 3). This contrasts with previous surveys when large numbers of COTS were widely spread throughout the Swain sector from the 1990's and into the 2000's. Four of the seven survey reefs previously had Active Outbreaks of COTS but all are now classified as Recovering and no Active Outbreaks have been recorded since 2006. No COTS were observed during scuba searches in this sector (Table 4).
Five of the seven survey reefs had stable coral cover. However, two of these reefs, both with total preservation status, remained at a very low coral cover (0-5%) as a result of cyclone Hamish that passed through this sector causing widespread coral damage in March 2009. In the most extreme case, coral cover at Reef 21-529 had been reduced from very high (50-60%) to very low (0-5%). Although cover had been low (5-10%) at Gannet Cay prior to cyclone Hamish, coral skeletons remained standing, providing a complex habitat that supported good numbers of coral recruits and fishes. Much of this structure was broken down by cyclone Hamish and low rubble beds now predominate. Coral cover at two Swain reefs had declined since last surveyed; declines at Snake Reef to low levels (5-10%) may also be attributable to cyclone Hamish but the drop from high (30-40%) to low (5-10%) coral cover at East Cay occurred after the passage of Hamish and the reason for this change is uncertain. Six of the seven reefs had low or very low coral cover, well below the GBR averages for their shelf position, and one (Chinaman) has recovered well from a previous outbreak with coral cover above the long-term midshelf GBR average (Table 3).
Table 3.Summary of manta tow survey results for the Swain sector
|
Reef |
Shelf Position |
Tows |
COTS |
COTS per tow |
Median % Live Coral Cover |
Median % Dead Coral Cover |
Median % Soft Coral Cover |
Reef Status |
|
Mid |
37 |
0 |
0 |
0 to 5 |
0 to 0 |
0 to 5 |
NO |
|
|
Mid |
20 |
0 |
0 |
0 to 5 |
0 to 0 |
0 to 5 |
RE |
|
|
Mid |
100 |
0 |
0 |
5 to 10 |
0 to 0 |
0 to 5 |
NO |
|
|
Mid |
35 |
0 |
0 |
20 to 30 |
0 to 0 |
0 to 5 |
RE |
|
|
Mid |
81 |
0 |
0 |
0 to 5 |
0 to 0 |
0 to 5 |
RE |
|
|
Outer |
70 |
1 |
0.01 |
5 to 10 |
0 to 0 |
0 to 5 |
NO |
|
|
Outer |
56 |
0 |
0 |
5 to 10 |
0 to 0 |
0 to 5 |
RE |
|
|
Overall GBR average last survey (2008) |
All |
ã | ã |
0.01 |
10 to 20 |
0 to 5 |
0 to 5 |
- |
|
Long-term average value |
Inner |
ã | ã |
0 |
30 to 40 |
0 to 5 |
0 |
- |
|
Long-term average value |
Mid |
ã | ã |
1.44 |
10 to 20 |
0 to 5 |
0 to 5 |
- |
|
Long-term average value |
Outer |
ã | ã |
1.2 |
20 to 30 |
0 to 5 |
0 to 5 |
- |
|
Average last survey (2008) |
Mid |
ã | ã |
0.01 |
20 to 30 |
0 to 5 |
0 to 5 |
- |
|
Average last survey (2008) |
Outer |
ã | ã |
0 |
20 to 30 |
0 to 5 |
5 to 10 |
- |
Scuba searches on the intensive survey sites (Table 4) showed few incidences of disease and numbers of the corallivorous snail, Drupella spp., were comparable to previous records. These results are not surprising given that live coral cover was low to very low on most survey reefs.
Table 4.Summary of results of scuba searches on reefs in the Swain sector
|
Reef |
Shelf Position |
COTS (<5cm) |
COTS (>5cm) |
COTS (>15cm) |
COTS (>25cm) |
WS |
BBD |
BrB |
SEB |
Drupella |
|
M |
0 |
0 |
0 |
0 |
0 |
0 |
0 |
1 |
1 |
|
|
M |
0 |
0 |
0 |
0 |
0 |
0 |
0 |
0 |
12 |
|
|
M |
0 |
0 |
0 |
0 |
2 |
0 |
0 |
1 |
10 |
|
|
M |
0 |
0 |
0 |
0 |
3 |
0 |
0 |
1 |
10 |
|
|
M |
0 |
0 |
0 |
0 |
15 |
0 |
5 |
2 |
6 |
|
|
O |
0 |
0 |
0 |
0 |
2 |
0 |
0 |
3 |
0 |
|
|
O |
0 |
0 |
0 |
0 |
0 |
0 |
0 |
0 |
1 |
|
|
Overall GBR Average last survey (2008) |
All |
0 |
0.021 |
0.11 |
0.043 |
14 |
0.19 |
4.9 |
4.8 |
15 |
|
Long term average |
I |
0 |
0 |
0.33 |
ã | ã | ã | ã | ã |
7.3 |
|
Long term average |
M |
0.02 |
0.45 |
3.3 |
0 |
11 |
0.16 |
1.4 |
2.5 |
23 |
|
Long term average |
O |
0 |
0.11 |
3.2 |
0 |
2.6 |
0.094 |
0.23 |
0.92 |
4 |
|
Average for last survey (2008) |
M |
0 |
0 |
0 |
0 |
29 |
1.2 |
3.4 |
9.6 |
4.4 |
|
Average for last survey (2008) |
O |
0 |
0 |
0 |
0 |
11 |
0 |
0.5 |
4 |
1.5 |
WS = White Syndrome, BBD = Black Band Disease, BrB = Brown Band Disease, SEB = Skeletal Eroding Band Disease.
Pompey Sector
Two reefs in the Pompey sector were surveyed using manta tows. One COTS was recorded at each reef (Table 5). COTS have been previously recorded in very low numbers (<4 per survey) at these reefs and both remain classified as No Outbreak.
Both survey reefs had suffered hard coral declines since 2009; given their proximity to the destructive path and the large amount of broken coral skeletons observed during surveys, this was almost certainly due to cyclone Hamish. When last surveyed in 2005, Reef 20-348 had moderate cover (10-20%) and Reef 20-354 had high coral cover (40-50%); both reefs now have very low coral cover (0-5%).
Table 5.Summary of manta tow survey results for the Pompey sector
|
Reef |
Shelf Position |
Tows |
COTS |
COTS per tow |
Median % Live Coral Cover |
Median % Dead Coral Cover |
Median % Soft Coral Cover |
Reef Status |
|
Mid |
57 |
1 |
0.02 |
0 to 5 |
0 to 0 |
0 to 5 |
NO |
|
|
Mid |
22 |
1 |
0.05 |
0 to 5 |
0 to 0 |
0 to 5 |
NO |
|
|
Overall GBR average last survey (2008) |
All |
ã | ã |
0.01 |
10 to 20 |
0 to 5 |
0 to 5 |
- |
|
Long-term average value |
Inner |
ã | ã |
0 |
0 to 5 |
0 |
0 to 5 |
- |
|
Long-term average value |
Mid |
ã | ã |
0.27 |
30 to 40 |
0 to 5 |
0 to 5 |
- |
|
Long-term average value |
Outer |
ã | ã |
0 |
40 to 50 |
0 to 5 |
5 to 10 |
- |
|
Average last survey (2008) |
Mid |
ã | ã |
0 |
0 to 5 |
0 to 5 |
0 |
- |
References
English, S., Wilkinson, C. and Baker, V. (1997) Survey Manual for Tropical Marine Resources (2nd Edition). Australian Institute of Marine Science. Townsville.
This project is partially supported by the Marine and Tropical Sciences Research Facility
For further information contact
Dr. Hugh Sweatman, AIMS
Telephone: +61 7 4753 4470
Fax: +61 7 4753 4288
Email: h.sweatman@aims.gov.au


