Dates: 11 April – 28 April 2012
Vessel: MV Floreat
Survey leader: Michelle Jonker
Summary
Manta tow surveys were completed on nine reefs in the Townsville sector of the Great Barrier Reef. Detailed surveys for benthic organisms, reef fishes and agents of coral mortality (scuba searches) were completed on twelve reefs in the sector. Three reefs (Kelso, Lynch's and Centipede) could not be manta towed because of bad weather. The preliminary results of the manta tow surveys and scuba searches are presented in this report.
The median reef-wide live hard coral cover was low in the Townsville sector; between 0-5% on eight reefs and 5-10% on one reef, and had declined from levels observed in 2010 surveys. The decline between 2010 and 2012 was attributed to Cyclone Yasi which passed north of the Townsville sector in early February 2011.
Manta tows in the Townsville sector in 2011 found that coral cover had declined on most reefs that were surveyed and there was evidence of storm damage, presumably caused by Cyclone Yasi. Of the two reefs that were surveyed in 2012, that were also surveyed post Cyclone Yasi in 2011, coral cover remained the same on one reef but had decreased slightly on the other.
No crown-of-thorns starfish (Acanthaster planci, COTS) were recorded in the Townsville sector on manta tow. One small A. planci was seen in scuba searches at Fore and Aft Reef, and another individual was observed in a crevice, outside the survey area, on scuba at Fork Reef. Hard coral cover was very low (0-5%) on the perimeter of eight reefs and low (5-10%) on one reef, Little Kelso. The manta tow survey results are summarised in Table 1.
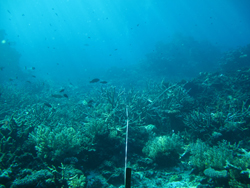
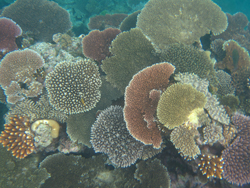
Low levels of bleaching of both hard and soft corals were recorded on many survey reefs. Bleaching signs included white patches, lighter or fluorescent coloured corals and complete white corals (see image 1 and 2). Corals that bleached were in the families Acroporidae, Pocilloporidae and Faviidae. Above average water temperatures were recorded on several reefs within the Townsville sector in 2012.
Water temperature data and bleaching threshold data is available here.
Coral disease incidences in the Townsville sector were generally within the range observed in previous surveys. However numbers of the coral eating gastropod, Drupella spp. and records of skeletal eroding band were higher than average values for the Townsville sector for some reefs. The scuba search results are summarised in Table 2.
Details of the manta tow and scuba search methods can be found in the Standard Operational Procedure No. 9. For a full explanation of COTS outbreak terminology used in this report, please click here.
Townsville sector
The perimeters of nine reefs were surveyed using manta tow (Table 1), these and an additional three reefs were surveyed in detail using scuba (Table 2). One small COTS was recorded at Fore & Aft Reef during scuba search surveys. This indicated minimal COTS activity on mid-shelf and outer shelf reefs in this sector that had hosted active COTS outbreaks in the early to mid 2000s. Members of the public have reported COTS on some inshore reefs in the past year, but no manta tows of inshore reefs were possible in 2012. Seven of the nine reefs that were surveyed remained classified as Recovering from COTS outbreaks, while two reefs (Roxburgh and Grub) remained classified as No Outbreak (Table 1).
The median reef-wide live coral cover was low (<10%) for all nine reefs and median reef-wide coral cover was very low (<5%) on eight of the reefs. Little Kelso was the only reef surveyed by manta tow where median reef-wide coral cover was 5-10%. While these reefs have historically had low coral cover as a result of major COTS outbreaks before 2006, the declines in hard coral cover recorded in 2012 were attributed to storm damage. Cyclone Yasi passed north of the Townsville sector in February 2011, and surveys in 2011 found evidence of patchy storm damage on most reefs in the Townsville sector, generally on the northern and eastern facing areas of each reef. Median reef-wide coral cover had been reduced from moderate levels (20-30%) to very low levels observed on Helix, Knife, Fork and Roxburgh reefs and reductions from low (5-10%) to very low levels were recorded on Grub and Rib reefs. Coral cover remained the same at three reefs (Chicken, Fore & Aft and Little Kelso). Chicken Reef was surveyed in 2011after Cyclone Yasi and a year later coral cover had decreased from low to very low levels. Fore & Aft Reef had not been surveyed by manta tow since 2008. Bleaching was observed at low levels on the slope of most reefs.
Scuba searches on the intensive survey sites showed that coral diseases and the numbers of the corallivorous gastropod, Drupella spp., were similar to previous years (Table 2). However, the number of Drupella on Centipede and Helix were higher than average values for mid-shelf Townsville reefs. While incidence of coral disease was average or below average, bleaching was consistently observed at low levels (individual colonies or 0-5% of total live hard coral cover) on eleven of the twelve reefs surveyed. On Rib Reef, where coral cover was very low (<5%), bleaching was observed on individual colonies accounting for up to 20% of the total coral cover. Water temperature data from a mid-shelf (Davies) and outer-shelf reef (Myrmidon) in the Townsville sector showed that the local bleaching thresholds (number of days where water temperature was greater than average) were reached during the 2012 Austral summer. The genera that were most often affected included those known to be susceptible to bleaching, as well as some not considered susceptible to bleaching. The genera that showed white patches or complete bleaching included Montipora, Seriatopora, Stylophora, Goniastrea, Montastrea, Favia, Favites and Pavona. Image 1 shows partial or focal bleaching of Montastrea sp.
For more information on water temperatures and local bleaching thresholds, click here to access data for Davies and Myrmidon Reefs.
Table 1. Summary of manta tow survey results for reefs in Townsville sector in 2012.
|
Reef |
Shelf |
Tows |
COTS |
COTS per tow |
Median % Live Coral Cover |
Median % Dead Coral Cover |
Median % Soft Coral Cover |
Reef Status |
|
Mid |
32 |
0 |
0 |
5 to 10 |
0 to 5 |
0 to 5 |
RE |
|
|
Mid |
34 |
0 |
0 |
0 to 5 |
0 to 5 |
0 to 5 |
RE |
|
|
Mid |
20 |
0 |
0 |
0 to 5 |
0 to 0 |
0 to 5 |
NO |
|
|
Mid |
52 |
0 |
0 |
0 to 5 |
0 to 0 |
0 to 5 |
RE |
|
|
Mid |
14 |
0 |
0 |
0 to 5 |
0 to 5 |
0 to 5 |
RE |
|
|
Mid |
42 |
0 |
0 |
0 to 5 |
0 to 0 |
0 to 5 |
NO |
|
|
Outer |
28 |
0 |
0 |
0 to 5 |
0 to 0 |
0 to 5 |
RE |
|
|
Outer |
34 |
0 |
0 |
0 to 5 |
0 to 0 |
0 to 5 |
RE |
|
|
Outer |
41 |
0 |
0 |
0 to 5 |
0 to 0 |
0 to 5 |
RE |
|
|
Overall GBR -average for last survey (2010) |
All |
|
|
0.02 |
10 to 20 |
0 to 5 |
0 to 5 |
- |
|
Long-term average |
Mid |
|
|
1.57 |
10 to 20 |
0 to 5 |
0 to 5 |
- |
|
Long-term average |
Outer |
|
|
1 |
10 to 20 |
0 to 5 |
0 to 5 |
- |
|
Average last survey (2010) |
Mid |
|
|
0 |
5 to 10 |
0 |
0 to 5 |
- |
|
Average last survey (2010) |
Outer |
|
|
0 |
10 to 20 |
0 |
0 to 5 |
- |
Table 2. Summary of scuba search survey results for reefs in the Townsville sector in 2012.
|
Reef
|
Shelf Position |
COTS (<5cm) |
COTS (>5cm) |
COTS (>15cm) |
COTS (>25cm) |
WS |
BBD |
BrB |
SEB |
Drupella |
|
Mid |
0 |
0 |
0 |
0 |
1 |
0 |
0 |
0 |
1 |
|
|
Mid |
0 |
0 |
0 |
0 |
6 |
0 |
2 |
2 |
6 |
|
|
Mid |
0 |
0 |
0 |
0 |
1 |
0 |
1 |
0 |
6 |
|
|
Mid |
0 |
0 |
0 |
0 |
2 |
0 |
0 |
1 |
19 |
|
|
Mid |
0 |
1 |
0 |
0 |
2 |
0 |
0 |
0 |
0 |
|
|
Mid |
0 |
0 |
0 |
0 |
2 |
0 |
0 |
10 |
24 |
|
|
Mid |
0 |
0 |
0 |
0 |
0 |
0 |
1 |
6 |
7 |
|
|
Mid |
0 |
0 |
0 |
0 |
2 |
0 |
1 |
1 |
22 |
|
|
Mid |
0 |
0 |
0 |
0 |
2 |
0 |
0 |
2 |
17 |
|
|
Outer |
0 |
0 |
0 |
0 |
8 |
1 |
1 |
3 |
3 |
|
|
Outer |
0 |
0 |
0 |
0 |
2 |
0 |
0 |
8 |
9 |
|
|
Outer |
0 |
0 |
0 |
0 |
0 |
0 |
1 |
0 |
4 |
|
|
Overall GBR- average for last survey (2010) |
All |
0 |
0.054 |
0.036 |
0.52 |
9.9 |
0.054 |
3.4 |
3.7 |
17 |
|
Long term average |
Mid |
0.013 |
0.46 |
4.3 |
0.89 |
2.9 |
0.015 |
0.5 |
2.1 |
16 |
|
Long term average |
Outer |
0.091 |
0.6 |
1.6 |
0 |
2.7 |
0.024 |
0.41 |
4.6 |
22 |
|
Average for last survey (2010) |
Mid |
0 |
0 |
0 |
0.11 |
3.2 |
0 |
0.89 |
3.4 |
13 |
|
Average for last survey (2010) |
Outer |
0 |
0 |
0 |
0 |
4.7 |
0 |
1.3 |
9.3 |
27 |
WS = White Syndrome, BBD = Black Band Disease, BrB = Brown Band Disease, SEB = Skeletal Eroding Band Disease.
For more information on coral diseases please peruse Standard Operational Procedure No. 9 and for more information on bleaching please click [here].
References
English, S., Wilkinson, C. and Baker, V. (1997) Survey Manual for Tropical Marine Resources (2ndEdition). Australian Institute of Marine Science. Townsville.
This project is partially supported by the Marine and Tropical Sciences Research Facility
For further information contact
Dr. Hugh Sweatman , AIMS
Telephone: +61 7 4753 4470
Fax: +61 7 4753 4288
Email: h.sweatman@aims.gov.au


